Figure 7.
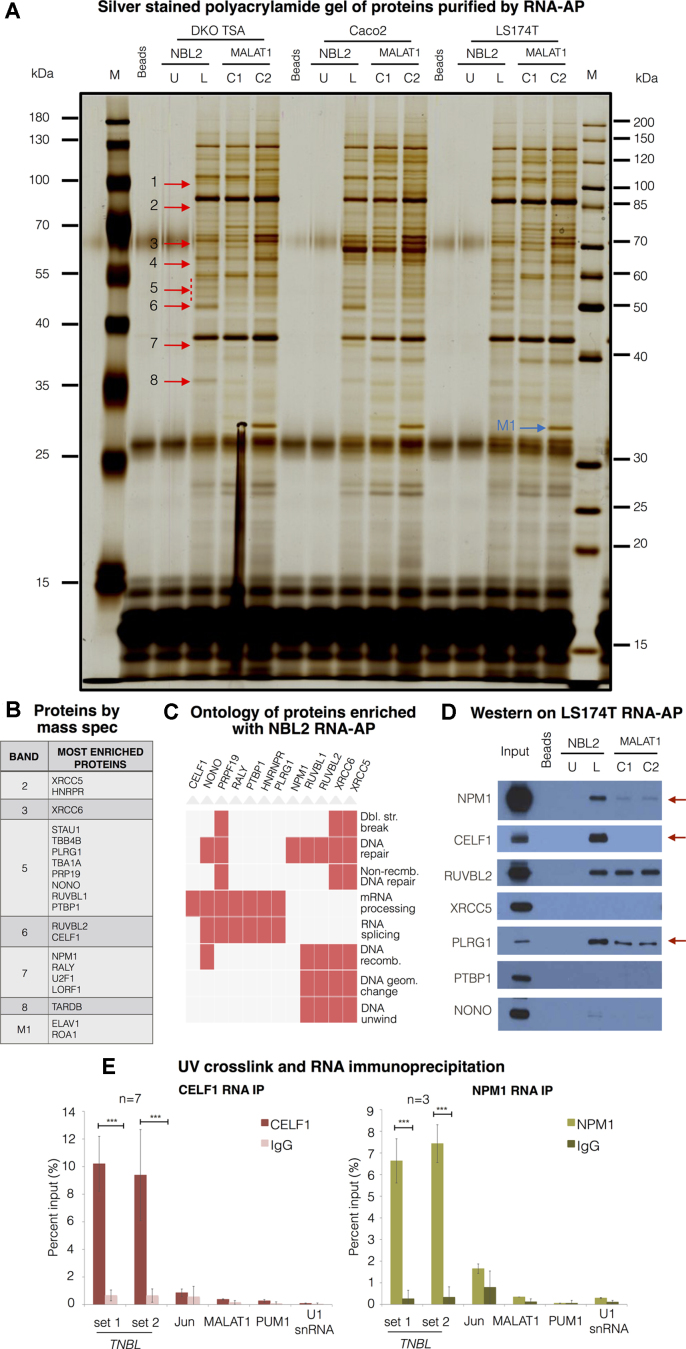
TNBL interacts with CELF1 and NPM1. (A) Polyacrylamide gel with size-separated proteins from RNA-affinity purification (RNA-AP). RNA-AP was performed with protein extracts from 3 CRC cell lines (DKO TSA treated cells, Caco-2 and LS174T). Probes: NBL2 monomer in vitro transcript (IVT) unlabeled (NBL2 U) as a background control, NBL2 monomer IVT biotin-labeled (NBL2 L), 2 biotin-labeled negative control IVTs corresponding to different regions of MALAT1 of the same size and GC content as NBL2 IVT (C1 and C2). Bands indicated with red arrows were cut and subjected to mass spectrometry in replicas. Band indicated with a blue arrow was pulled down only with MALAT1 IVT 2. U stands for unlabeled, L for labeled. (B) Proteins with most peptide count within each band. (C) Functional ontology of proteins enriched with NBL2 RNA-AP. (D) Western blot validation of proteins pulled down with RNA-AP. NBL2 IVT specifically interacts with NPM1 and CELF1 compared with negative control IVTs. (E) UV crosslink and RNA IP with antibodies against CELF1 (left) and NPM1 (right) in LS174T TNBL high expressing clone. TNBL enrichment was monitored by RT-qPCR with two primer sets (1 and 3). Enrichment of JunD, MALAT, PUM1 and U1 snRNA was monitored to control background precipitation. Error bars indicate s.d., CELF1 RNA IP n = 7, NPM1 RNA IP n = 3. ***P ≤ 0.001, as evaluated by unpaired t-test versus IgG.

