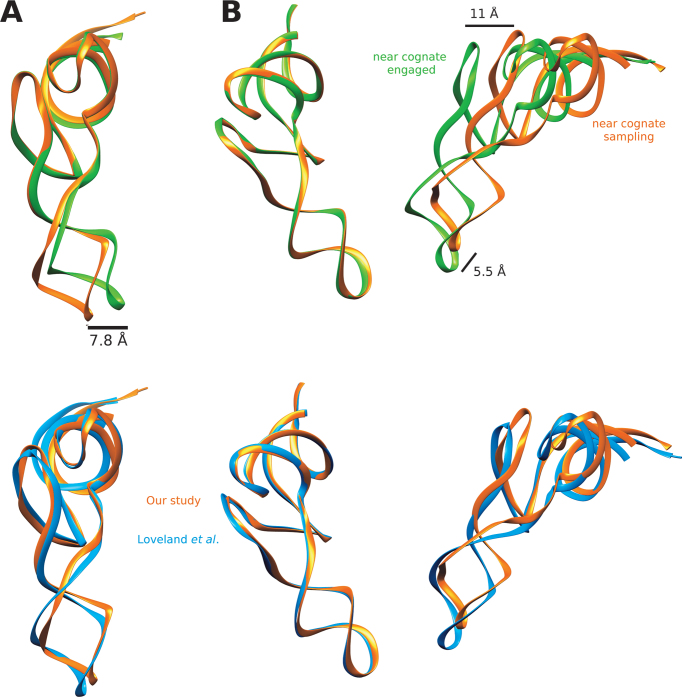
Figure 6.
(A) Overlay of the A/T-site tRNA structures from the complexes C3 (orange) and C4 (green) representing the sampling and engaged state respectively. (B) Going from the sampling (orange, C3a) to the engaged state (green, C4) of the ribosome, the tRNA moves closer to the P-site tRNA. The bottom overlay compares our study C3 (orange) and Loveland et al. IInc (blue).

