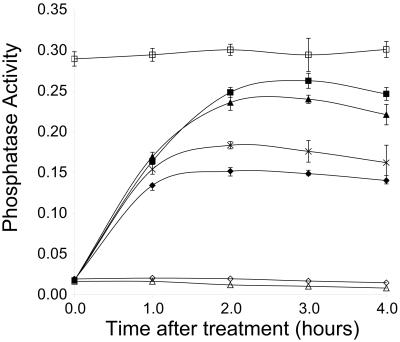
Figure 2.
Analysis of Pho5 activity induced by inhibitor treatment using the liquid phosphatase assay. Units of activity were calculated by dividing the measured OD420 by the OD600 of the yeast suspension used in the assay and are displayed on the vertical axis. Time after inhibitor addition is shown on the horizontal axis. The strains and treatments shown are: EY0822 (pho85Δ) + DMSO (□); EY0824 (PHO85F82G) + 10 μM 1-Na PP1 (■), + 5 μM 1-Na PP1 (▴), + 1 μM 1-Na PP1 (crosses), + 0.5 μM 1-Na PP1 (⧫), or + DMSO (◊); and EY0826 (PHO85WT) + 10 μM 1-Na PP1 (▵). Each point shown is the mean of three independent experiments, and the error bars indicate two standard deviations.

