Figure 2.
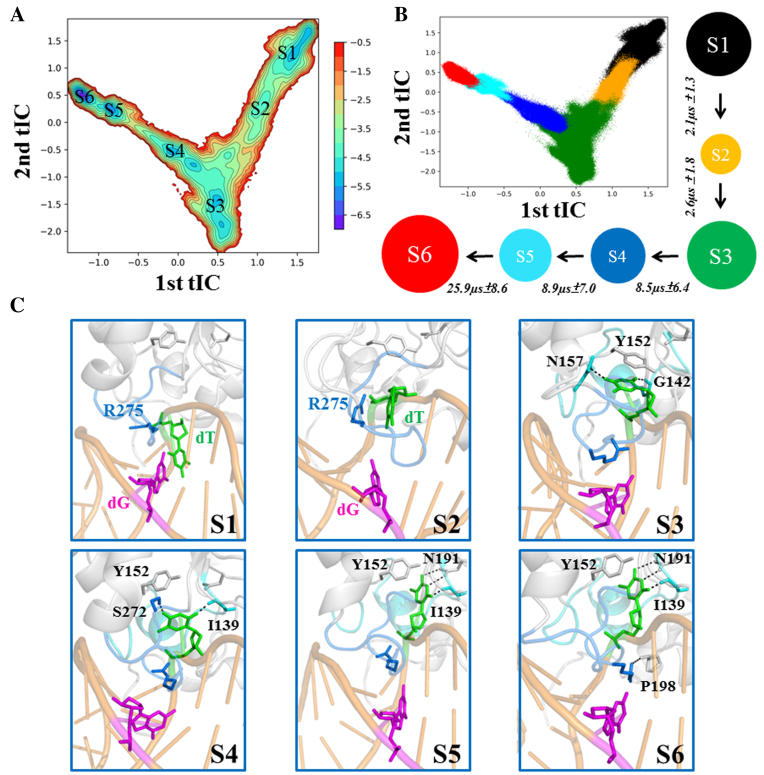
The MSM captures six metastable states during the base-flipping process of mispaired dT nt. (A) Free energy projections of all the MD conformations onto the two slowest tICs, the location of each macrostate is labeled (from S1 to S6). (B) A scatter plot with each MD conformation mapped onto the two slowest tICs. The snapshots that belong to the same macrostate are shown in a same color: S1 (black), S2 (orange), S3 (green), S4 (blue), S5 (cyan), S6 (red). In addition, the 6-state kinetic network derived from the MSM is provided, with the size of each circle roughly proportional to the corresponding equilibrium population: 18.8 ± 3.7% (S1); 4.0 ± 1.2% (S2); 25.2 ± 4.7% (S3); 11.1 ± 2.3% (S4); 11.3 ± 2.5% (S5); 29.7 ± 9.2% (S6) and the MFPT for the forward transition is also provided above each arrow. (C) Selected representative conformation for each macrostate (S1–S6). The structure was randomly selected from the most populated microstate for each macrostate. Key residues that interact with the dT nt (in green) are shown in sticks. Several key hydrogen bonds are highlighted with dashed lines. Refer to Figure 1 for other representations.

