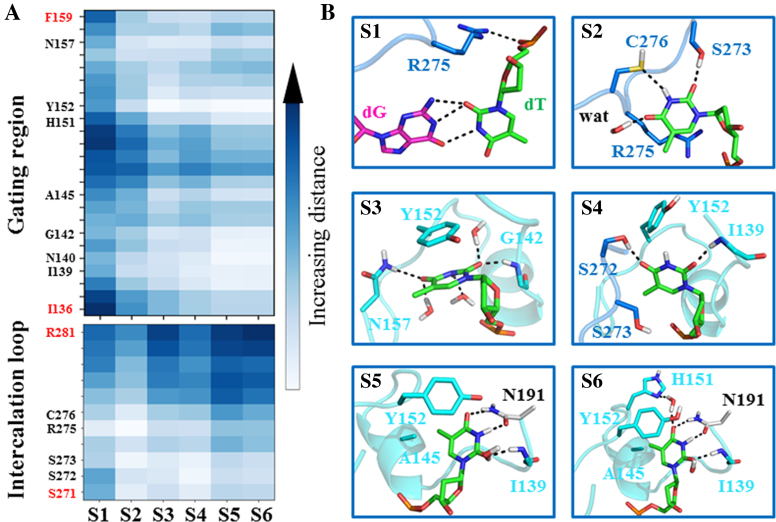
Figure 3.
Structural analysis for each metastable state involved in the base-flipping process. (A) Distances between the heavy atoms of the mismatched dT nt and the Cα of each residue from two TDG motifs: the intercalation loop (S271–R281) and the gating region (I136–F159). For each state, the average value over all the conformations belong to that state is plotted. (B) Highlighted interactions between the mimatched dT nt and its surrounding residues/waters. The same representative conformations from Figure 2 are used here, in which the intercalation loop (S271–R281) and the gating region (I136–F159) are shown in blue and cyan, respectively.

