Figure 5.
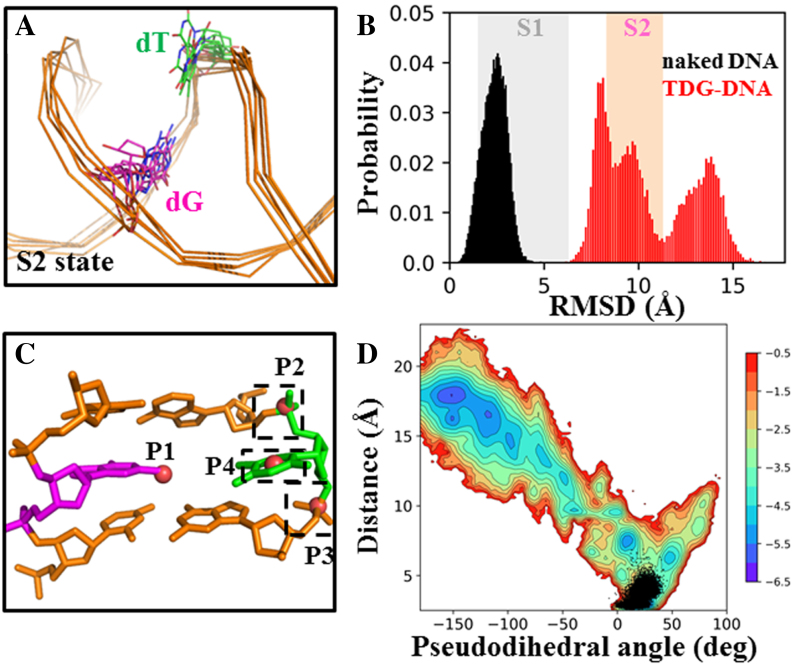
TDG is actively involved in the base-flipping process. (A) Five random TDG–DNA conformations from the S2 state were chosen and superimposed, with only DNA chains shown. (B) Histograms of RMSD of the mispaired dT nt relative to the IC for the DNA system with (in red) and without TDG (in black). In the background, the fluctuations of the RMSD values calculated based on the MSM are represented by colored boxes for S1 (in gray) and S2 (in pink). (C) Four points, namely P1-P4, are used to define the pseudodihedral for the base-flipping process. P1 is the center of mass (COM) of the two base pairs adjacent to the mismatched bp (in orange); P2 and P3 are the COMs of two phosphate groups connecting to the flipped base, respectively; P4 is the COM of the six-member pyrimidine ring of the flipped nt. (D) Free energy profile of the MD conformations projected onto two reaction coordinates: the pseudodihedral defined in (C) and the COM distance between the dT nt (O2 and N3 atoms) and its opposite dG nt (N1 and O6 atoms). The corresponding values calculated for the naked DNA conformations from the 3 μs straigtfoward MD trajectory are plotted in black dots.

