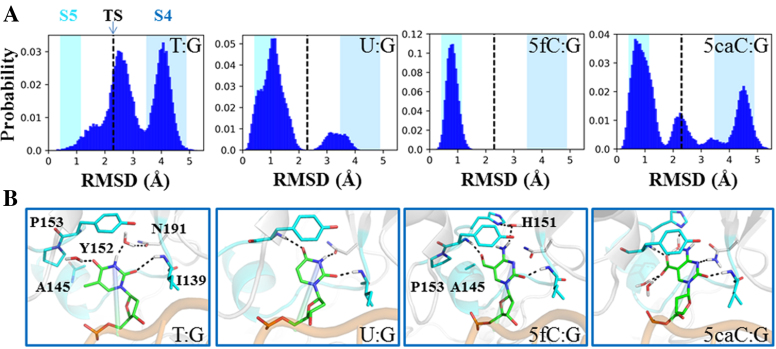
Figure 6.
Comparisons of the base-flipping process for different TDG substrates: dT, dU, 5fC, and 5caC. (A) Histogram plots of the RMSD of the flipped nt relative to the minimized RC for each substrate. The starting structures are chosen near the transition state (TS) regions between S4 and S5 and are labeled with black dashed line in each plot. In the background, the fluctuations of the RMSD values calculated based on the MSM are represented by colored boxes for S4 in blue and S5 in cyan. (B) Representative conformations for each of the four substrates. For dT nt, one conformation near the TS is selected. For other three bases, the flipped state is used.

