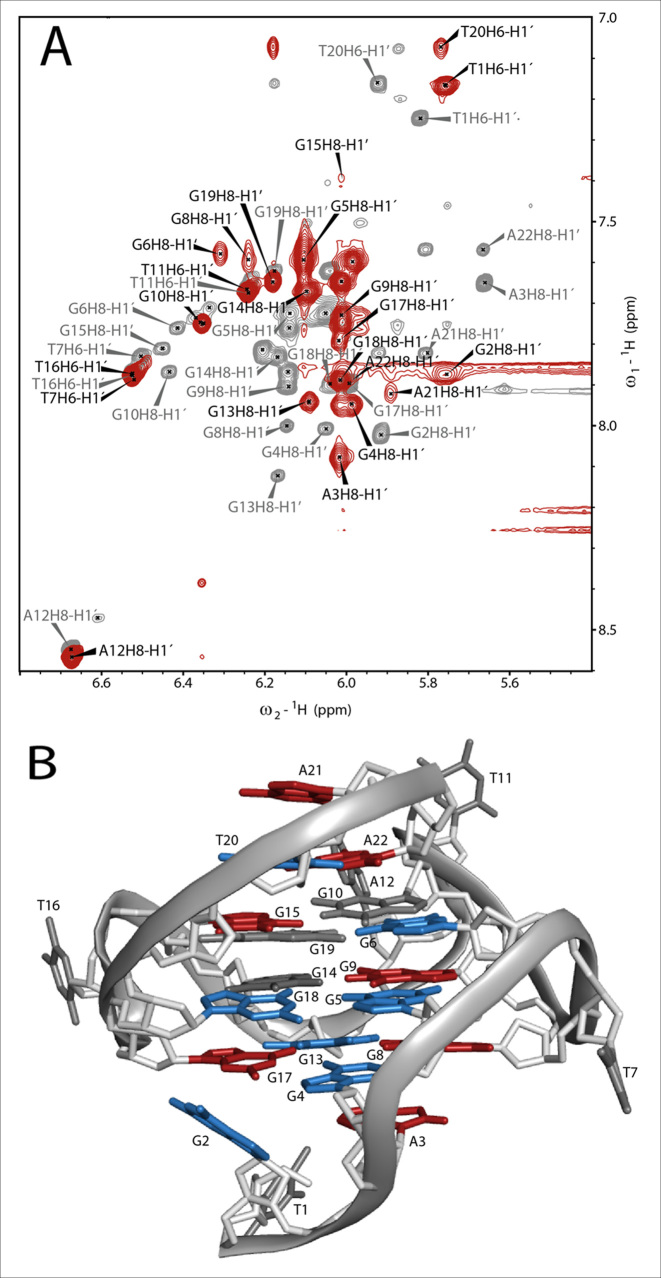
Figure 5.
(A) Overlay of the H1′H6/H1′H8 region of the 1H,1H-NOESYs of c-MYC14/23 (gray) and the complex (red). The assignment of c-MYC14/23 (gray labels) has been transferred from Yang et al. (10). The attempt of assignment of the signals for the complex (black labels) is based on the analysis of 1H,13C-HSQC (Supplementary Figure S18) and the 1H, 1H-NOESY spectra. In the overlay it is already possible to estimate qualitatively the strength of chemical shift perturbation (CSP) of the anomeric (H1′) and aromatic (H6/H8) protons after ligand binding. Experimental conditions: 298 K, 25 mM potassium phosphate pH 7.0, 70 mM KCl, 10% d6-DMSO,1 mM DNA (gray spectrum) and 1 mM DNA with 3 eq. of TH3. (B) Structure of c-MYC14/23 (PDB: 1XAV) with colored nucleobases according to their combined CSP after ligand binding with residue numbering according to Figure 4C. Gray: non shifted (CSP ≤ 0.1), blue: moderately shifted (CSP = 0.1 – 0.2) and red: strongly shifted (CSP > 0.2).

