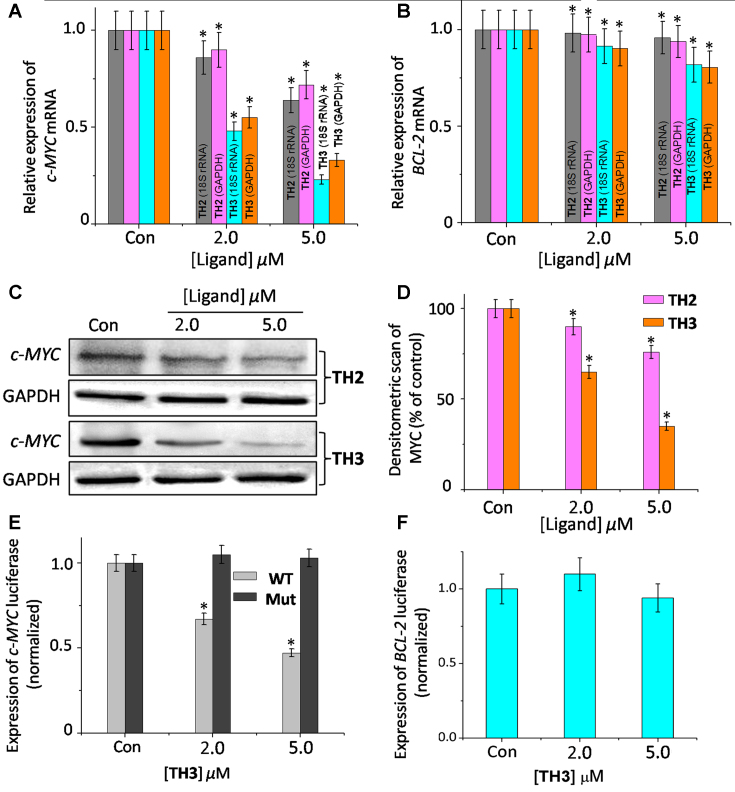
Figure 6.
Determination of transcriptional regulation of (A) c-MYC mRNA, (B) BCL-2 mRNA in the presence of TH2 and TH3 in cancer cells (HeLa) by qRT-PCR and quantified by double delta Ct analysis using 18S rRNA and GAPDH as reference genes. Data is presented in terms of fold change. Data shown as mean ± SD. *P < 0.05, versus untreated cancer cells; (C) immunoreactive bands of c-MYC protein were analyzed by Western blot in HeLa cells. Data shown as mean ± SD. *P < 0.05, versus untreated cancer cells; (D) the protein expression of c-MYC protein in the presence of TH2 and TH3 in HeLa cells. Relative luciferase expression in (E) Del4 c-MYC/mut-c-MYC and (F) LB322 BCL-2 promoter containing firefly plasmid normalized with pRL-TK Renilla plasmid (FF/RL) upon treatment of TH3 in HeLa cells, Data shown as mean ± SD. *P < 0.05, versus untreated cancer cells.

