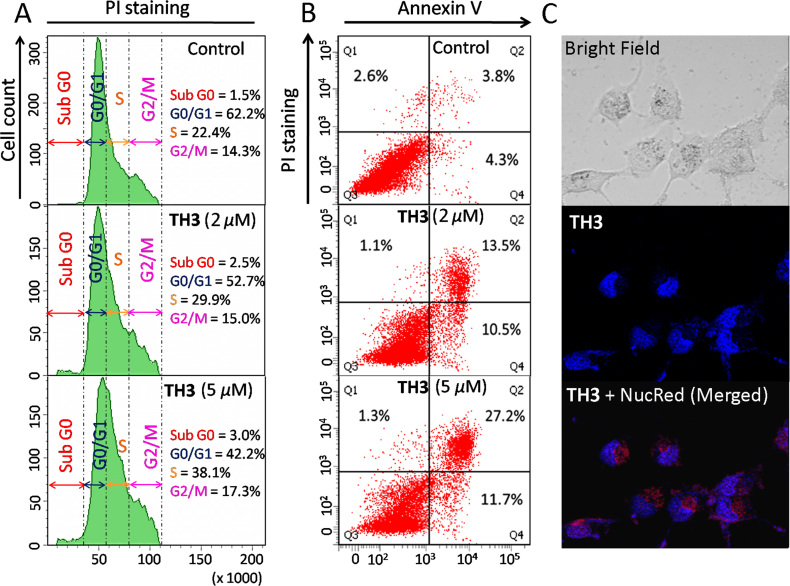
Figure 7.
(A) Flow cytometric analysis of cell cycle parameters after incubation of HeLa cancer cells with TH3 (2.0 and 5.0 μM). (B) Flow cytometric analysis of the mode of cancer cell death after treatment with TH3 (2.0 and 5.0 μM) in HeLa cancer cells; Lower left (Q3), lower right (Q4), upper right (Q2) and upper left (Q1) quadrants indicate healthy cells, early, late apoptotic and necrotic cells, respectively. (C) Fluorescence microscopic image of localization of TH3 (5.0 μM) in HeLa cell.

