Figure 2.
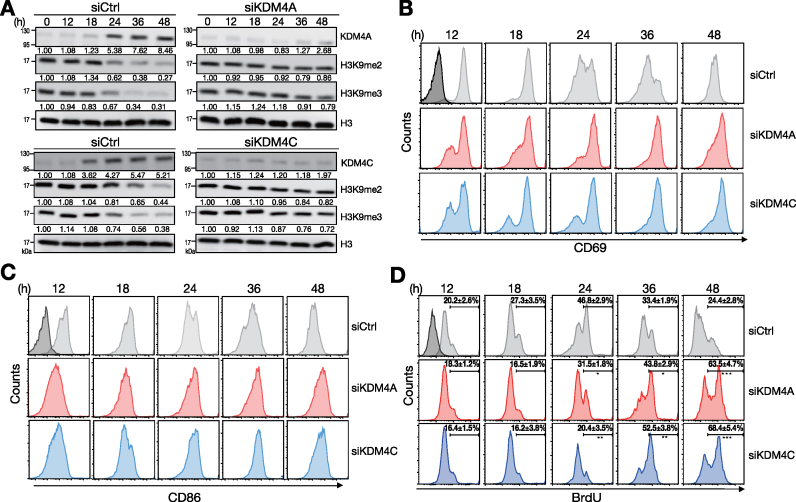
B cell activation and proliferation sustains by depletion of KDM4A or KDM4C. (A) Immunoblot showing the levels of KDM4A, KDM4C and H3K9me2/me3 histone modification markers in [HEL + anti-CD40 + IL-21]-stimulated MD4 splenic B cells transfected with control siRNA or siRNA-pools against KDM4A or KDM4C. (B, C) FACS analysis showing the levels of activation markers CD69 (B) and CD86 (C) on stimulated MD4 splenic B cells after depletion of KDM4A or KDM4C at indicated time points. (D) FACS analysis showing the frequencies of BrdU incorporation in stimulated MD4 splenic B cells transfected with siCtrl, siKDM4A- or siKDM4C-pools at indicated time points. Relative levels of indicated proteins in (A) after quantification were indicated. Results are the mean ± SD (n = 3) in (D). *P < 0.05, **P < 0.01, *** P < 0.005 (Student's t-test). Dark-shaded histograms in (B), (C) and (D) represent the levels of indicated molecules at day 0.

