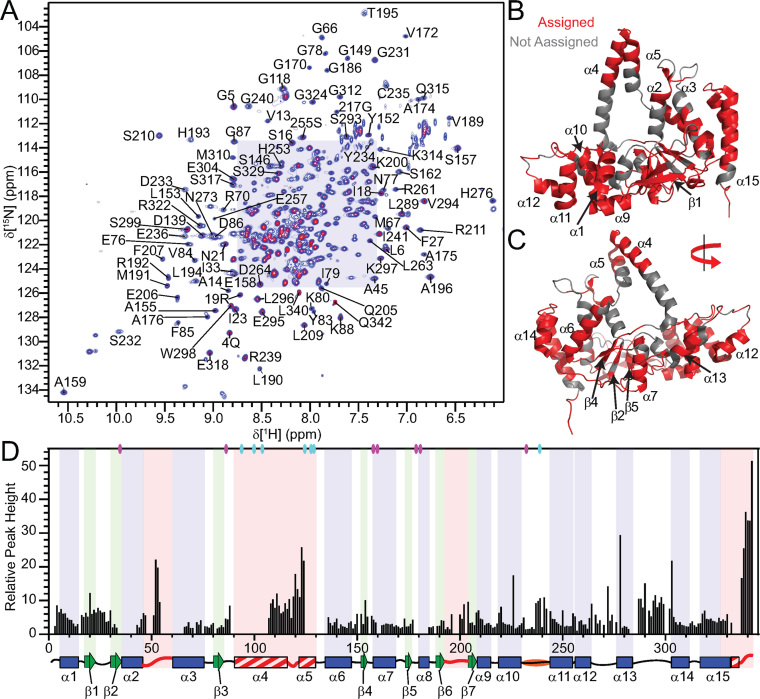
Figure 2.
Relative peak heights suggest differences in dynamics in regions of hFEN1. (A) 1H–15N-TROSY spectrum of hFEN1 under experimental conditions. Peaks from amide side chains and the two tryptophan side-chain indole groups (Hϵ–Nϵ) are also observed. Expanded views of the shaded region can be found in Supplementary Figure S4. (B) Front and (C) rear views of the hFEN1 structure (3Q8K) (11) with labeled secondary structure elements and colored backbone to denote assigned (red) or unassigned (gray) residues. (D) Relative peak height (based on the lowest intensity peak E257) obtained from the 1H–15N-TROSY spectrum of hFEN1 plotted versus residue number show that loops are generally more intense and are flanked by decreasing peak intensities and sometimes missing residues. A secondary structure schematic of hFEN1 (3Q8K) is included (11). Blue rectangles, green arrows and black lines indicate α-helices, β-strands and loops, respectively. Loops known to have structural heterogeneity (1UL1 versus 3Q8K) are indicated by red lines (11,22). Red and white stripped rectangles highlight regions of structural heterogeneity. The H2tH α10–α11 loop is highlighted in orange. The location of the active site carboxylate (D34, D86, E158, E160, D179, D181 and D233) and basic residues (K93, R100, R104, K125, K128, R129 and R238) with respect to secondary structure elements are indicated by magenta and cyan ovals, respectively.

