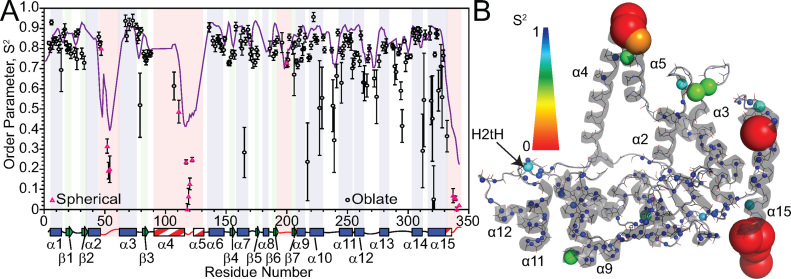
Figure 3.
Model-free analysis of hFEN1 relaxation data identifies regions with increased flexibility. (A) Generalized order parameters (S2) were derived from relax (52) using backbone 15N relaxation data acquired at two field strengths and plotted versus residue number. Black circles represent data fitted to the oblate spheroid diffusion tensor, whereas pink triangles were fitted to a spherical diffusion tensor. The purple line in (A) represents the TALOS-N (32) random coil index S2 prediction. Secondary structure map as described in Figure 2D. (B) S2 values plotted on a cartoon depiction of the hFEN1 protein structure (3Q8K) (11). The spheres represent the nitrogen nuclei for which data were derived. The S2 and Rex spectrum bars illustrate the magnitude of S2 and Rex values with respect to sphere color and size.

