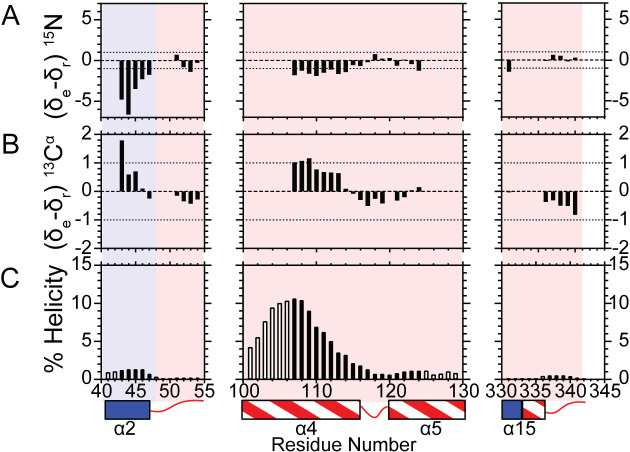
Figure 4.
15NH and 13Cα chemical shifts for the disordered arch region indicate that only some of the residues are sampling helical conformations. Bar graphs indicate the magnitude of the difference of experimental (δe) and sequence-corrected random coil chemical shifts (δr) for (A) 15NH and (B) 13Cα for the indicated regions. Differences less than one (dotted line) suggest disorder. The anti-correlated nature of 15NH and 13Cα is used to suggest which segments of the disordered region populate either helical or extended peptide backbone angles. Positive and negative 15NH and 13Cα chemical shift differences, respectively, imply extended backbone angles, whereas negative and positive 15NH and 13Cα chemical shift differences, respectively, suggest sampling α-helical backbone angles (53). (C) Agadir helical percentage predictions for the indicated residues assessed at 114 mM ionic strength, pH 7.5 and 25°C (NMR conditions) (54). Black bars indicate the residues for which NMR data is available to validate the prediction, whereas open bars indicate an absence of NMR assignments. A secondary structure map is illustrated below as described in Figure 2D.

