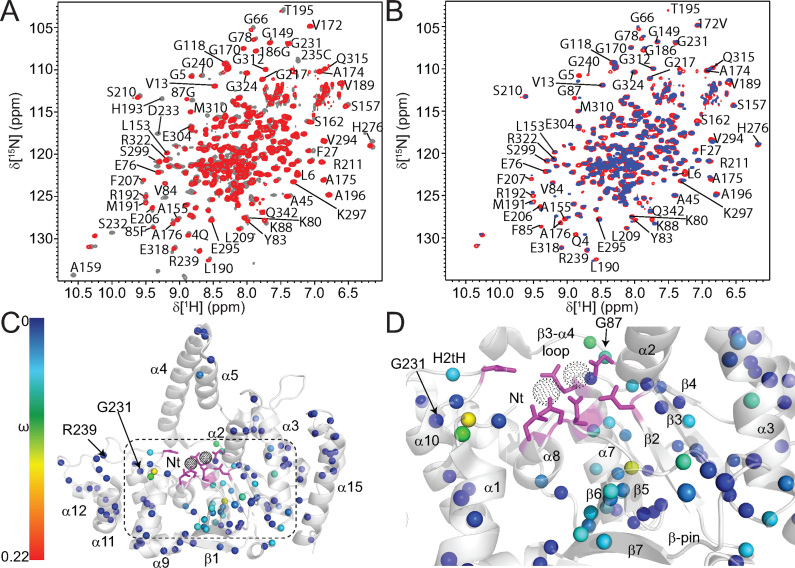
Figure 5.
Addition of Ca2+ ions to hFEN1K93A perturbs chemical shifts nearest the active site. (A) Superposed 1H–15N TROSY spectra of hFEN1 (gray) and hFEN1K93A (red) shows only minimal changes in localized regions close to the mutation site indicating no widespread effects on global structure. (B) Superposed 1H-15N TROSY spectra of hFEN1K93A in the absence (red) and presence (blue) of Ca2+. Well-dispersed residues are labeled accordingly. (C) Chemical shift changes observed on the addition of Ca2+ ions to hFEN1K93A are mapped onto a cartoon representation of the hFEN1 structure (3Q8K) (11). The black-dotted spheres indicate the locations of active site metal ions that are coordinated by the side chains of carboxylate residues shown as magenta sticks. Secondary structure elements, the H2tH motif and the N-terminus (Nt) are labeled. The locations of the G231 and R239 spheres are highlighted. The magnitudes of the nitrogen nuclei chemical shift perturbations (ω) are represented by sphere color according to the associated spectrum bar. The absence of a sphere either indicates the lack of assignment in the protein or the inability to follow chemical shift changes due to peak overlap. (D) Magnified view of the area indicated by the dashed box in panel C to highlight the location of residues most affected by the addition of Ca2+ ions to hFEN1K93A. Labels are as described in panel C except for the omission of R239 and addition of G87.

