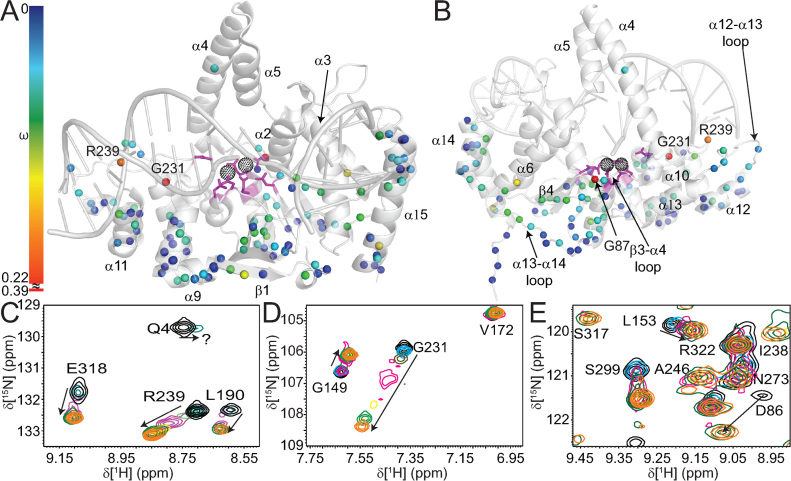
Figure 6.
Addition of Ca2+ ions to the hFEN1K93A–DNA complex show chemical shift perturbations (ω) throughout the protein. (A) Front and (B) rear views of a cartoon depiction of the hFEN1–DNA structure (3Q8K) (11) with the magnitudes of nitrogen nuclei chemical shift perturbations (ω) on addition of Ca2+ represented by sphere color according to the associated spectrum bar. Note, because the chemical shift change for G231 was larger than for most other residues, the spectrum bar is discontinuous. (C−E) Highlighted regions from Supplementary Figure S8C showing several residues with significant chemical shift perturbations that occur upon titration with Ca2+ at 0 mM (black), 0.5 mM (cyan), 1 mM (olive), 2 mM (magenta), 4 mM (yellow), 6 mM (green) and 8 mM (orange). The panels show a large ω for (C) L190, R239 and E318, (D) G149 and G231 and (E) the appearance of S317 at higher Ca2+ concentrations. Intermediate exchange behavior is highlighted for (C) Q4 and (E) D86.

