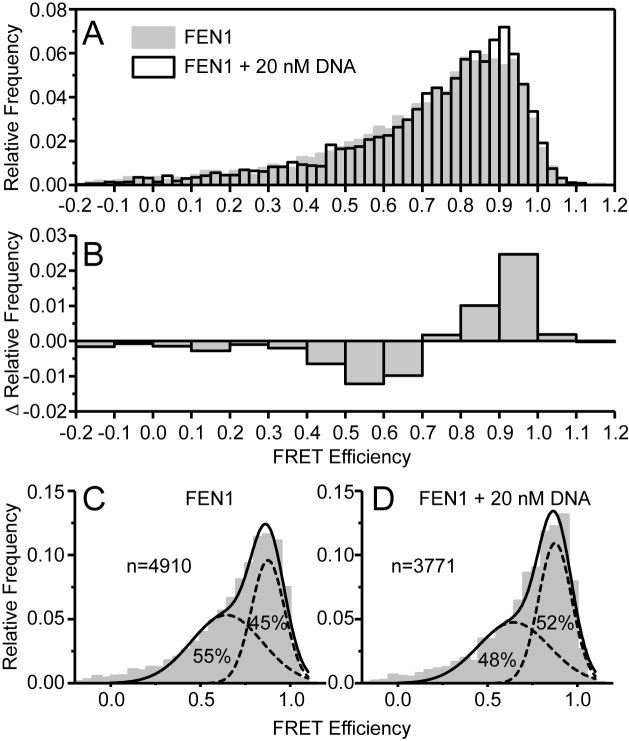
Figure 7.
smFRET shows a change in conformational ensemble upon addition of DNA and reveals millisecond conformational dynamics occurring in the arch region. (A) Relative frequencies of FRET efficiencies for hFEN1QF alone (gray) and in complex with 20 nM DNA (white). (B) The difference in relative frequencies of FRET efficiencies upon addition of 20nM DNA. (C) hFEN1QF alone and (D) hFEN1QF with 20 nM DNA showing the unrestrained fit to the sum of two Gaussian functions (see Supplementary Table S4 for fitting parameters) to show that upon addition of DNA the lower FRET population decreases and the higher FRET population increases.

