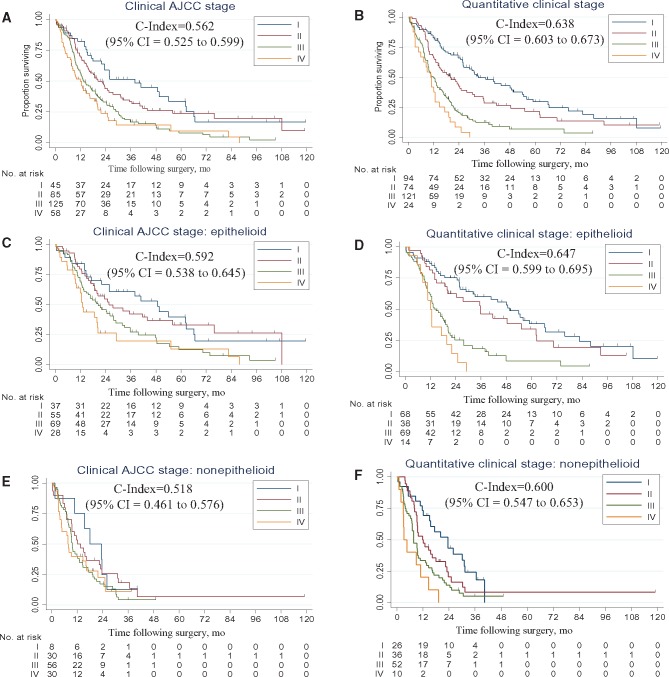
Figure 2.
Kaplan-Meier survival curves depicting estimated survival functions. Results are presented according to the (A)AJCC Cancer Staging Manual (7th ed.) clinical stage, (B) quantitative clinical stage, (C) AJCC Cancer Staging Manual (7th ed.) clinical stage: epitheloid subtype, (D) quantitative clinical stage: epithelpoid subtype, (E) AJCC Cancer Staging Manual (7th ed.) clinical stage: nonepitheloid subtype, and (F) quantitative clinical stage: nonepitheloid subtype. C-indexes are shown, with their corresponding 95% confidence intervals in parentheses. AJCC = American Joint Committee on Cancer; CI = confidence interval.

