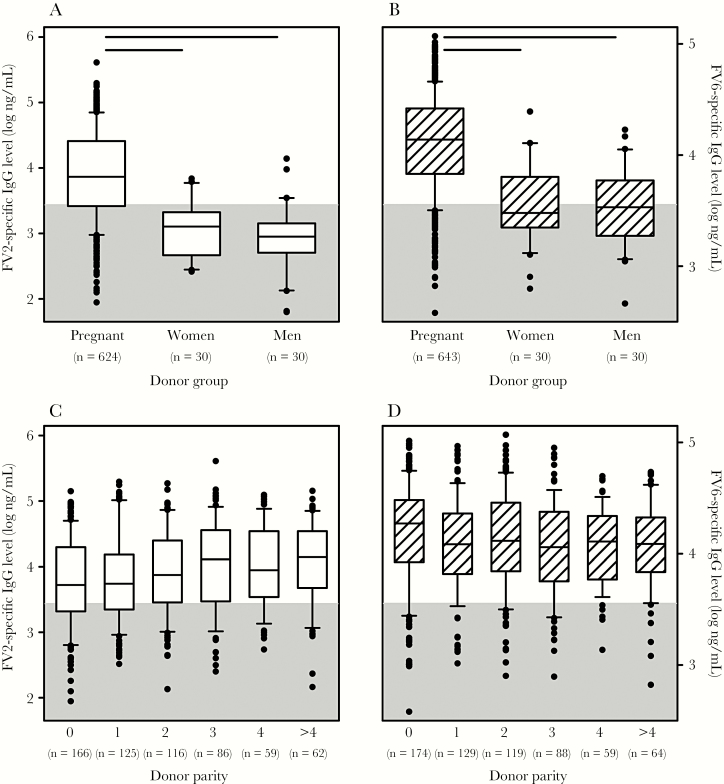
Figure 1.
Plasma levels of Plasmodium falciparum family erythrocyte membrane protein 1 (PfEMP1)–specific immunoglobulin G (IgG). A, Levels of FV2-specific IgG in plasma from Ghanaian pregnant women, nonpregnant women, and men. Median values (center lines), interquartile ranges (boxes), interdecile ranges (bars), and outliers (points) are shown. The number of donors in each group is indicated along the bottom of the panel. Statistically significant differences (P < .05) are indicated by horizontal bars along the top of the panel. B, Levels of FV6-specific IgG in plasma from Ghanaian pregnant women, nonpregnant women, and men. Measures of central tendency and dispersion are as described in panel A. C, Relationship between plasma levels of FV2-specific IgG and parity among pregnant women. D, Relationship between plasma levels of FV6-specific IgG and parity among pregnant women. The cutoff for positivity (calculated as the mean level [plus 2 standard deviations] measured in 10 nonexposed Danish control donors) is indicated by gray shading in all panels.

