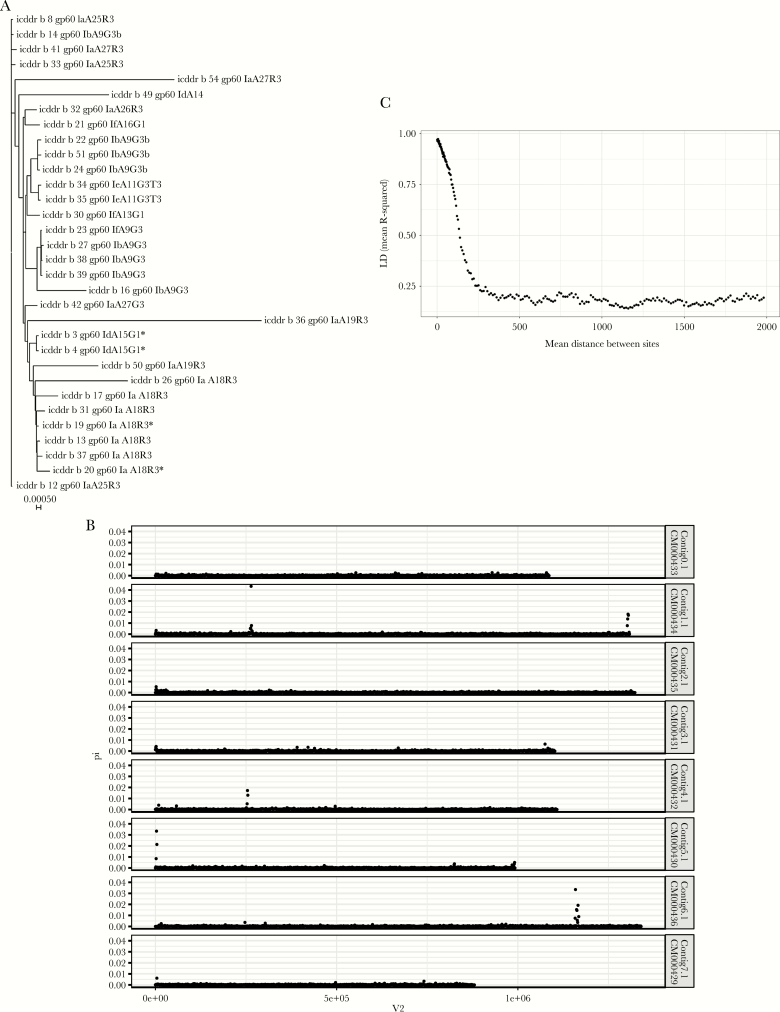
Figure 2.
Genomic diversity of Bangladesh Cryptosporidium hominis. A, Phylogenetic tree of C. hominis genomes. Neighbor-joining tree was based on the high confidence single-nucleotide polymorphisms (SNPs) occurring with a frequency ≥0.2 in the 32 Mirpur genomes. Branches are labeled with genome ID and associated gp60 genotype. Scale bar indicates genome-wide distance between samples in nucleotide substitutions per site. *Genomes from a “paired” oocyst preparation (isolated from different aliquots of the fecal material collected from a single child at one time point [icddr,b 3 and 4] or at a 10-day interval [icddr,b 19 and 20]), indicating that diversity can occur in the parasite population within a single child. B, Cryptosporidium hominis polymorphic regions. Graph indicates the distribution of allele frequencies, and the number of SNPs on the C. hominis chromosomes. Pi (y-axis) is defined as the average number of nucleotide differences per nucleotide site between 2 samples, and is a measure of allelic heterogeneity. The x-axis (V2) indicates the chromosome position (bp). C, High rates of recombination are apparent in this C. hominis population. Average linkage disequilibrium (LD) (y-axis) between neighboring SNPs as a function of the distance (bp) separating them in the genome (x-axis) for Bangladesh C. hominis. The graph was generated using the data from 32 Bangladesh C. hominis genomes, which had >80% genome coverage of at least 10 times. The pairwise values were calculated using the SNPs with minor allele frequency >0.20. The y-axis indicates the average R2 value (the square of the correlation coefficient of 2 SNPs) and x-axis the physical separation 0–2000 bp.

