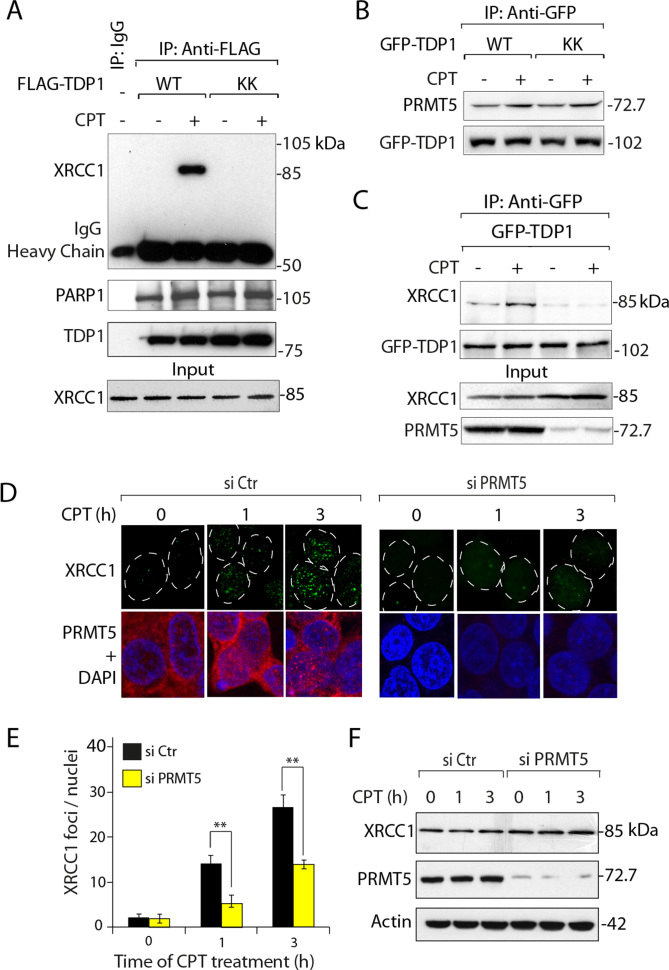
Figure 6.
TDP1 methylation promotes TDP1-XRCC1 association and XRCC1 focal accumulation in response to Top1cc sites. (A) Wild-type (WT) and methylation-mutant (KK) flag-tagged TDP1 were ectopically expressed in HCT116 cells. After CPT treatment (5 μM, 3 h), ectopic TDP1 was immunoprecipitated using anti-flag antibody and the immune complexes were blotted with anti-XRCC1 antibody. The same blot was stripped and blotted with anti-PARP1 and anti-TDP1 antibody. Aliquots (10%) of the input show the similar level of XRCC1 prior to immunoprecipitation. Migration of protein molecular weight markers (kDa) is indicated at right. (B) Methylation mutant TDP1 (GFP-TDP1KK) was not deficient in interaction with PRMT5. HCT116 cells ectopically expressing GFP-TDP1 constructs (GFP-TDP1WT and GFP-TDP1KK) were treated with or without CPT (5 μM, 3 h). GFP-TDP1 was immunoprecipitated using anti-GFP antibody and the immune complexes were blotted with anti-PRMT5 antibody. The same blot was stripped and reprobed with anti-GFP antibody to show equal loading. (C) PRMT5 depletion compromises the association of XRCC1 with TDP1. HCT116 cells were transfected with PRMT5 (siPRMT5) or control (Ctr) siRNA, followed by ectopic expression of GFP-TDP1WT. Following CPT treatment (5 μM, 3 h), ectopic GFP-TDP1 was immunoprecipitated using anti-GFP antibody and the immune complexes were blotted with anti-XRCC1 antibodies. The same blot was stripped and reprobed with anti-GFP antibody. Aliquots (10%) of the input show the level of PRMT5 knockdown, and XRCC1 prior to immunoprecipitation. Electrophoretic migration of protein molecular weight markers (kDa) is indicated at right. (D) Kinetics of appearance of nuclear XRCC1 foci in control and HCT116 cells transfected with PRMT5 siRNA. Cells were treated with CPT (5 μM). XRCC1 foci and PRMT5 are shown in green and red, respectively. Nuclei were stained with DAPI (blue). (E) Quantification of CPT-induced XRCC1 foci per nucleus (marked in dotted circle) obtained from immunofluorescence confocal microscopy were calculated for 20–25 cells (calculated value ± S.E.M.) and plotted as a function of time. Asterisks denote significant difference (**P < 0.001; t test) in CPT-induced XRCC1 foci between control and PRMT5 siRNA-transfected HCT116 cells. (F) siRNA knockdown of PRMT5 does not reduce XRCC1 expression. HCT116 cells were transfected with PRMT5 or control (Ctr) siRNA, then treated with CPT (5 μM) for indicated times (h) and protein levels (XRCC1 and PRMT5) were analyzed by Western blotting (Representative experiment is shown). Actin served as loading control. Electrophoretic migration of protein molecular weight markers (kDa) is indicated at right.

