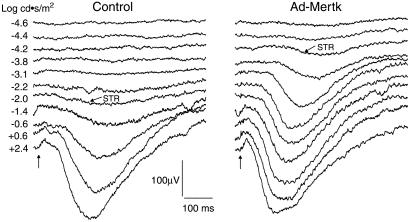
Figure 5.
Scotopic ERG intensity series from the uninjected eye (Left) and contralateral dialyzed Ad-Mertk-injected eye (Right) of an RCS rat at P60. Vertical arrows indicate application of the stimulus. Slanted arrows indicate STRs recorded at threshold stimulus intensity. The difference in the STR threshold between the control and treated eyes in this animal is greater than two log units.

