
Fig. 8.
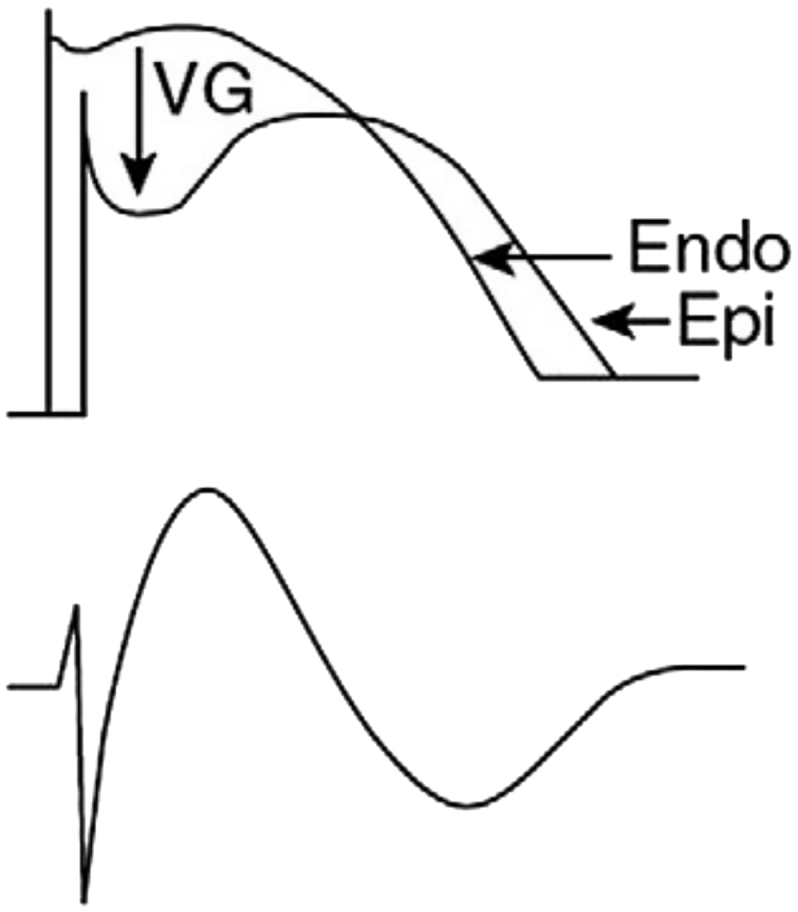
Schematic illustration of type 1 Brugada pattern. “The difference in endocardial [Endo] and epicardial [Epi] action potential (above) due to increased transient outward current of K+ (Ito) in RVOT epicardium at the beginning of phase 2 gives rise to a local voltage gradient [VG] as seen on the ECG in right precordial leads (under).” With permission from: Bayés de Luna A, Brugada J, Baranchuk A, et al. Current electrocardiographic criteria for diagnosis of Brugada pattern: a consensus report. J Electrocardiol. 2012;45:433–42.