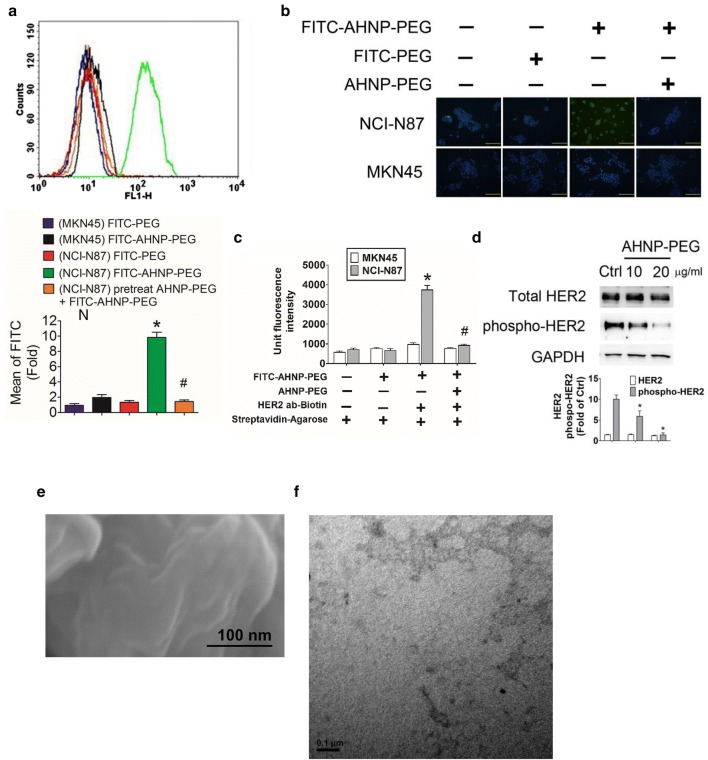
Fig. 4.
AHNP-PEG targeted to HER2 and reduced HER2 phosphorylation in GC cells. a AHNP-PEG binding assay was determined by flow cytometry in GC cells. MKN45 and NCI-N87 cells were treated with FITC-AHNP-PEG (20 μg/ml) for 2 h. In competitive group, NCI-N87 cells were pre-treated with AHNP-PEG (non-FITC; 20 μg/ml) for 1 h and then treated with 20 μg/ml FITC-AHNP-PEG for 2 h. Data are presented as mean ± SEM (n ≥ 3). *P < 0.05, versus FITC-PEG. #P < 0.05, versus FITC-AHNP-PEG. b AHNP-PEG binding assay was observed by using fluorescent microscopy in GC cells. NCI-N87 and MKN45 cells were treated with FITC-AHNP-PEG (20 μg/ml) for 2 h. The nuclei were stained with 4′,6-diamino-2-phenylindole. Magnification: ×400, scale bar: 50 μm. c AHNP-PEG and HER2 interaction assay. NCI-N87 and MKN45 cells were treated with FITC-AHNP-PEG (20 μg/ml) for 4 h at 4 °C. The supernatant of lysates was incubated with or without biotinylated-HER2 polyclonal antibody (2 μg/ml) in the presence of streptavidin agarose beads at 4 °C overnight. The fluorescent signaling of immunoprecipitates was detected by using ELISA reader. The AHNP-PEG (non-FITC; 20 μg/ml) was pretreated for competitive inhibition assay. Data are presented as mean ± SEM (n ≥ 3). *P < 0.05, versus FITC-PEG. #P < 0.05, versus FITC-AHNP-PEG. d The protein expressions of total and phosphorylated HER2 in AHNP-PEG-treated GC cells. NCI-N87 cells were treated with AHNP-PEG (10 and 20 μg/ml) for 24 h. Protein expressions were determined by Western blotting and quantified by densitometry and normalized by GAPDH levels. The data are presented as mean ± SEM (n ≥ 3). *P < 0.05, versus control group (Ctrl). e, f The structural and shape characteristics of the DTPA-AHNP-PEG by Scanning electron microscope (e; magnification: ×300 K, scale: 100 nm) and Transmission electron microscopy (f; magnification: ×100 K, scale: 100 nm)

