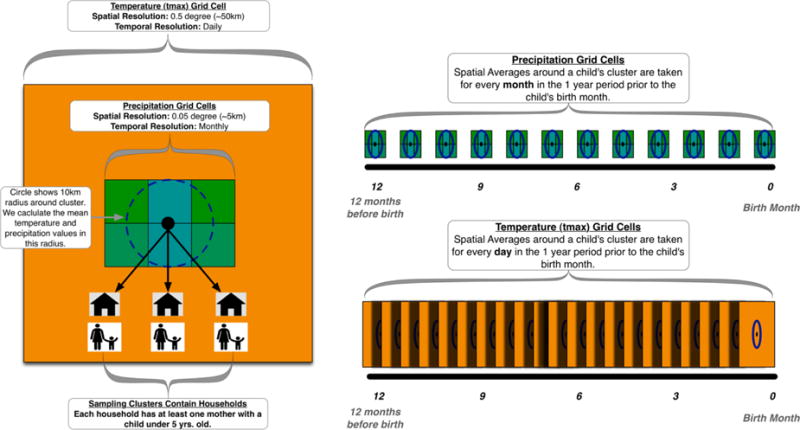
Figure 2. Merging data of different spatial and temporal scales.

Here, data of differing spatial and temporal scales is merged to capture heat stress (count of days above a threshold temperature, tmax) for each trimester of pregnancy. The outcome of interest is low birth weight. Monthly precipitation is also included to measure quality of the growing season, a proxy measure for food availability. Health data are organized with births nested within women, then women nested in households, which are then nested in communities (or spatial clusters). The spatial information of the community is offset by 5-10 km to maintain confidentiality of the respondents. The offset requires the user to average over a 10 km radius.
Source: Graphic developed by Frank Davenport
