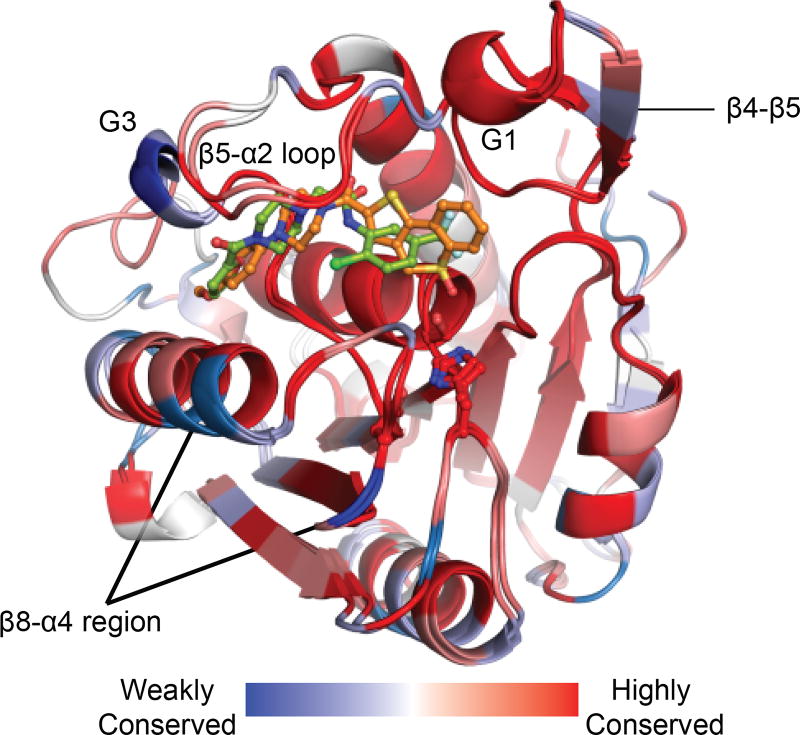
Figure 4. Divergence in APT1•ML348 and APT2•ML349 structures.
Blue regions signify divergence between APT1 and APT2. The inhibitor selectivity filter APT1-L176M and APT2-M178L is shown in grey sticks in the β8/α4 region. Adapted with permission from (Won et al. 2016). A color version of the figure is available online.

