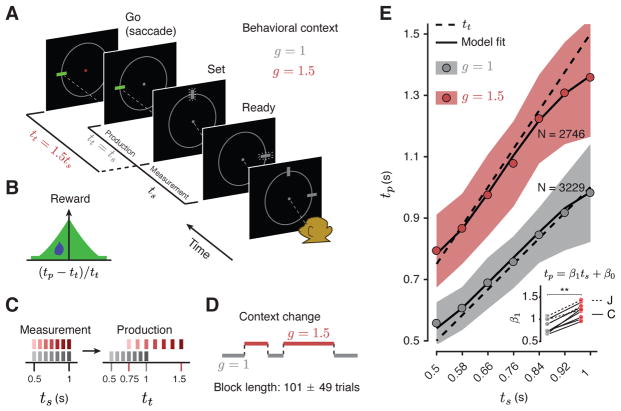
Figure 1. The RSG task and behavior.
(A) RSG task. On each trial, three rectangular stimuli associated with “Ready,” “Set,” and “Go” events were shown on the screen arranged in a semi-circle. Following fixation, Ready and Set cues were extinguished. After a random delay, first Ready and then Set stimuli were flashed (small lines around the rectangles signify flashed stimuli). The time interval between Ready and Set demarcated a sample interval, ts. The monkey’s task was to generate a saccade (“Go”) to a visual target such that the interval between Set and Go (produced interval, tp) was equal to a target interval, tt, equal to ts multiplied by a gain factor, g (tt = gts). The animal had to perform the task in two behavioral contexts, one in which tt was equal to ts (g = 1 context), and one in which tt was 50% longer than ts (g = 1.5 context). The context was cued throughout the trial by the color of fixation and the position of a context stimulus (small white square below the fixation). (B) Reward. Animals received juice reward when the error between tp and tt was small, and the reward magnitude decreased with the size of error (see Methods for details). On rewarded trials, the saccadic target turned green (panel A). (C) Sample and target intervals. For both contexts, ts was drawn from a discrete uniform distribution with seven values equally spaced from 0.5 to 1 sec (left). The values of ts were chosen such that the corresponding values of tt across the two contexts were different but partially overlapping (right). (D) Context blocks. The context changed across blocks of trials. The number of trials in a block was varied pseudorandomly (mean and std shown). (E) Behavior. tp as a function of ts for each context across both monkeys and all recording sessions (behavior of each animal is shown separately in Figure S1). Circles indicate mean tp across all sessions, shaded regions indicate +/− one standard deviation from the mean, dashed lines indicate tt, and solid lines are the fits of a Bayesian observer model to behavior. Inset: Slope of the regression line (β1) relating tp to ts in the two contexts. Regression slopes were larger in the g = 1.5 context, with a significant interaction between ts and g (p < 0.0001) for all sessions (see text; ** indicates p < 0.002 for signed-rank test). Regression intercepts (β0) were also larger for the g = 1.5 context (0.14 vs. 0.18 sec, p = 0.04). In all panels, different shades of gray and red are associated with g =1 and g = 1.5, respectively. See Figure S1 for individual animals.

