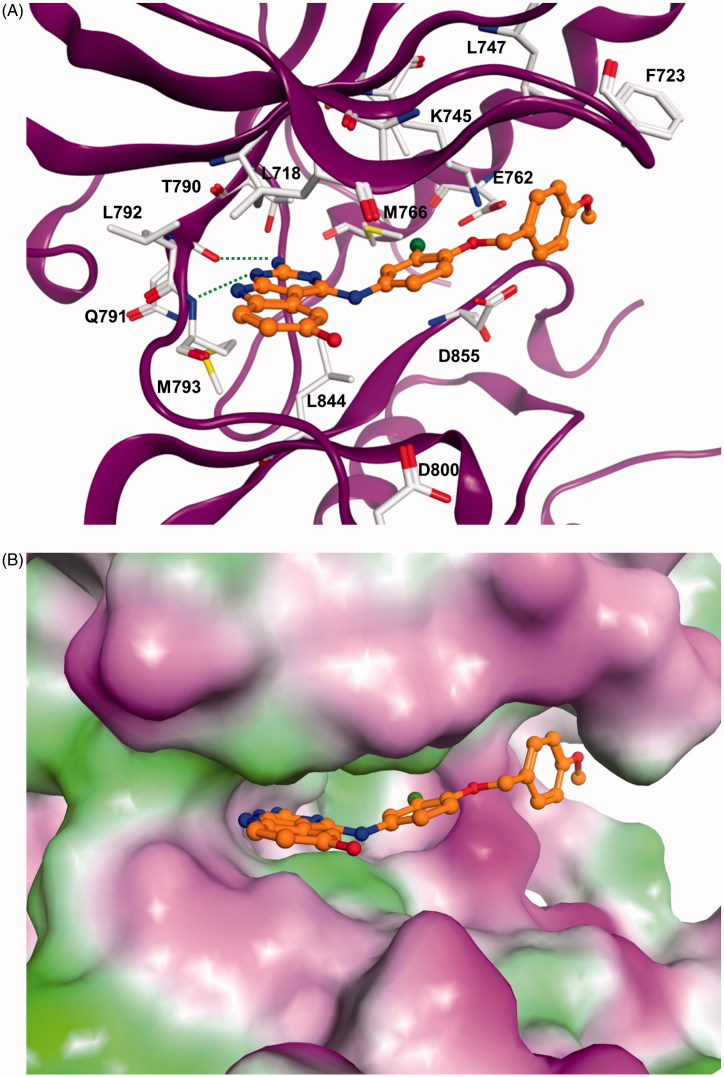
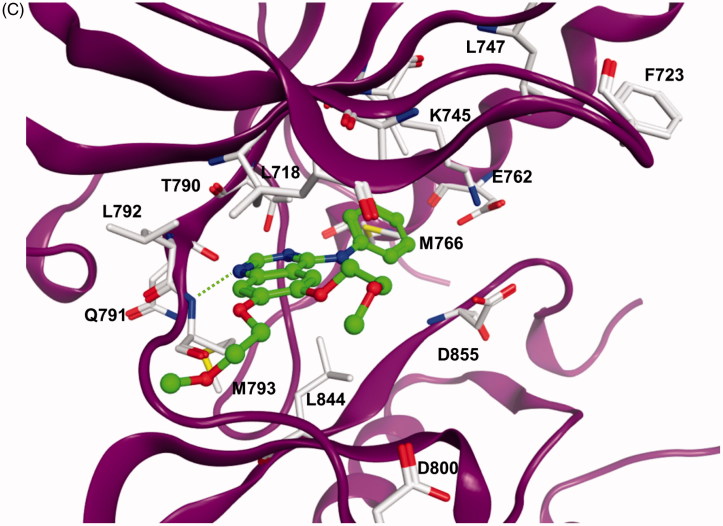
Figure 1.
(A) Docking solution for 5l at EGFR. The inhibitor structure is coloured orange, hydrogen bonds are shown as green dashed lines. Only amino acid residues of the ATP-binding pocket are shown. (B) Visualization of the molecular surface of the ATP-binding pocket coloured according to the hydrophobicity (polar regions are coloured magenta, hydrophobic regions are coloured green). (C) X-ray structure of EGFR in complex with erlotinib (coloured green). Hydrogen bonds are shown as green dashed lines.


