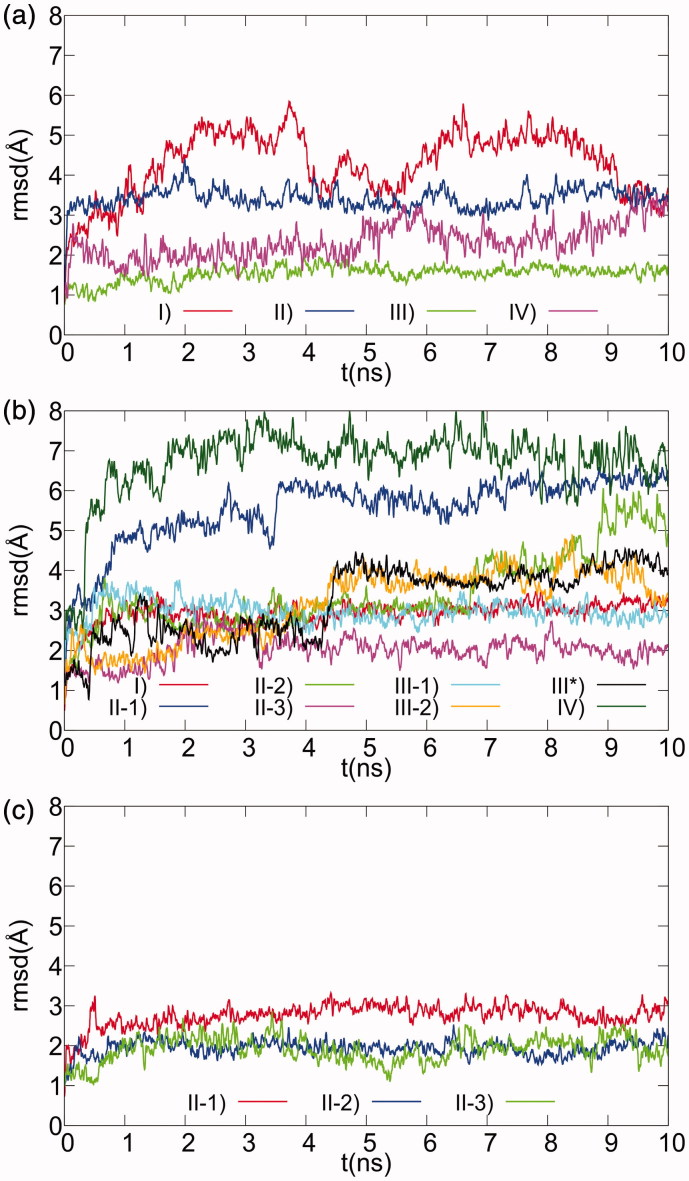
Figure 3.
Ligand RMSD plots for MD simulations of selected docking models of XO complexes with Compounds 1–3. The positional RMS deviations for ligand atoms during the 10 ns MD refinement runs, calculated after best fit of the protein backbone atoms, are shown for the 1 (a), 2 (b), and 3 (c) XO-complex models selected after docking.

