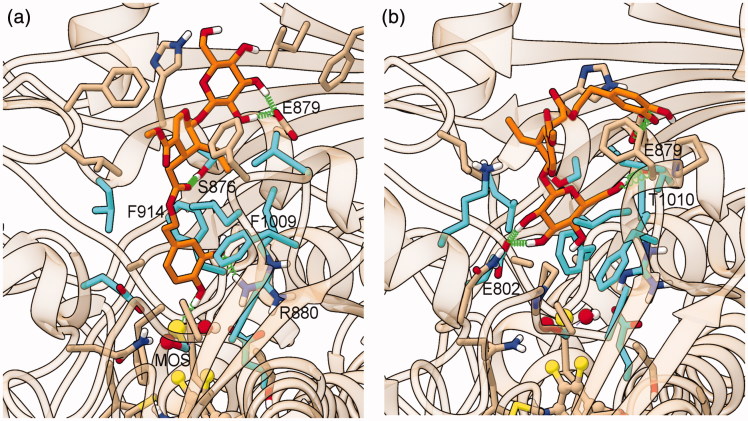
Figure 6.
Representative structures of the ligand binding site of the final models of the XO complexes with oleuropein (Compound 2). The sites of the representative frames from the last 5 ns of MD for the XO-oleuropein complexes I (a) and II-3 (b) are shown with the same representation and colors used in Figure 4, except for C atoms of oleuropein, in orange.

