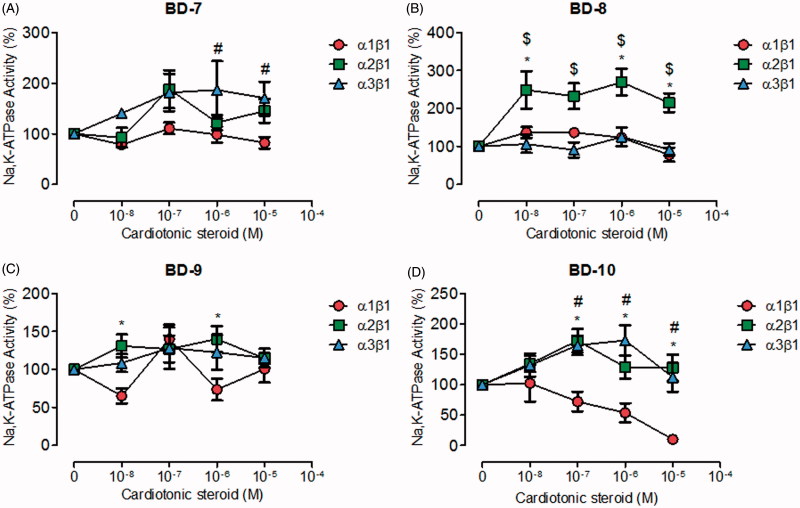
Figure 3.
NKA activity (%) from Sf9 cell membrane preparations after BD-7 (A), BD-8 (B), BD-9 (C), and BD-10 (D) treatment for 20 min. *p < .05 differences between NKA α1β1 and α2β1 isoforms. $p < .05 differences between NKA α2β1 and α3β1 isoforms. #p < .05 differences between NKA α1β1 and α3β1 isoforms. Each point represents the mean ± SEM of at least three independent experiments performed in triplicate.

