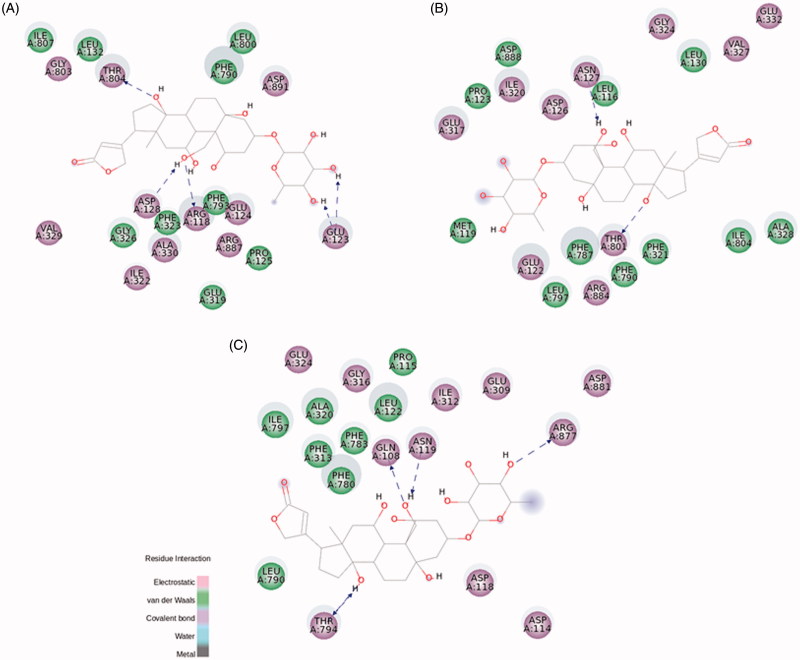
Figure 5.
Ouabain molecular docking on rat NKA α1 (A), α2 (B), and α3 (C) isoforms. The green and magenta circles represent residues involved in van der Waals and polar interactions, respectively. The blue halo around the residue is proportional to the solvent accessible surface. Pi interactions are represented by an orange line and symbols indicating the specific interaction. The green dashed arrows are directed towards the electron donor and represent hydrogen bonds with amino acid main chains. The blue dashed arrows are directed towards the electron donor and represent hydrogen bonds with amino acid side-chains.

