Figure 7.
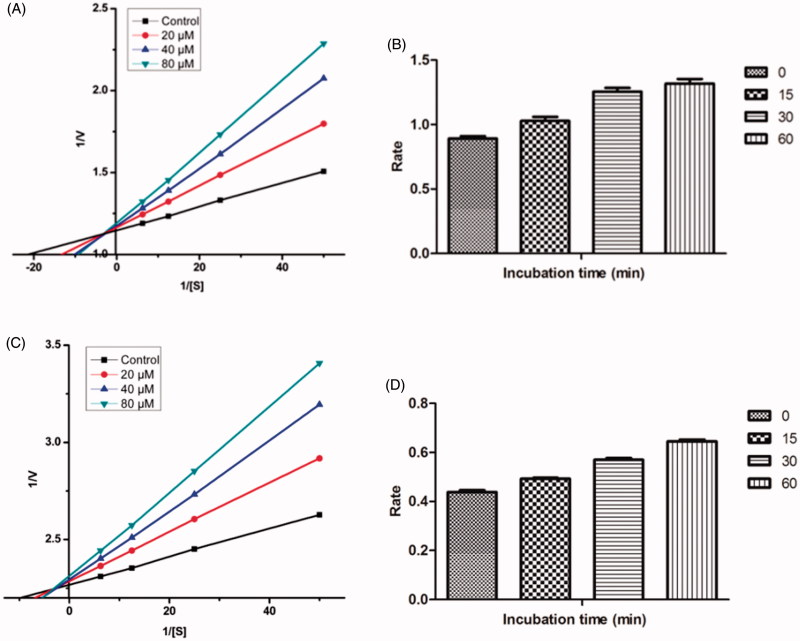
(A) Kinetics of rat brain AChE inhibition by compound 21. Lineweaver–Burk plot of the rat brain AChE catalysed oxidation of ACTI in the absence (control) and presence of various concentrations of compound 21 (20, 40, and 80 µM). (B) Time-dependant inhibition of AChE catalysed oxidation of ACTI by compound 21. Rate data are expressed as nmol product formed/min/mg protein. (C) Kinetics of equine serum BuChE inhibition by compound 17. Lineweaver–Burk plot of the equine serum BuChE catalysed oxidation of BuTI in the absence (control) and presence of various concentrations of compound 17 (20, 40, and 80 µM). (D) Time-dependant inhibition of BuChE catalysed oxidation of BuTI by compound 17. Rate data are expressed as nmol product formed/min/mg protein.

