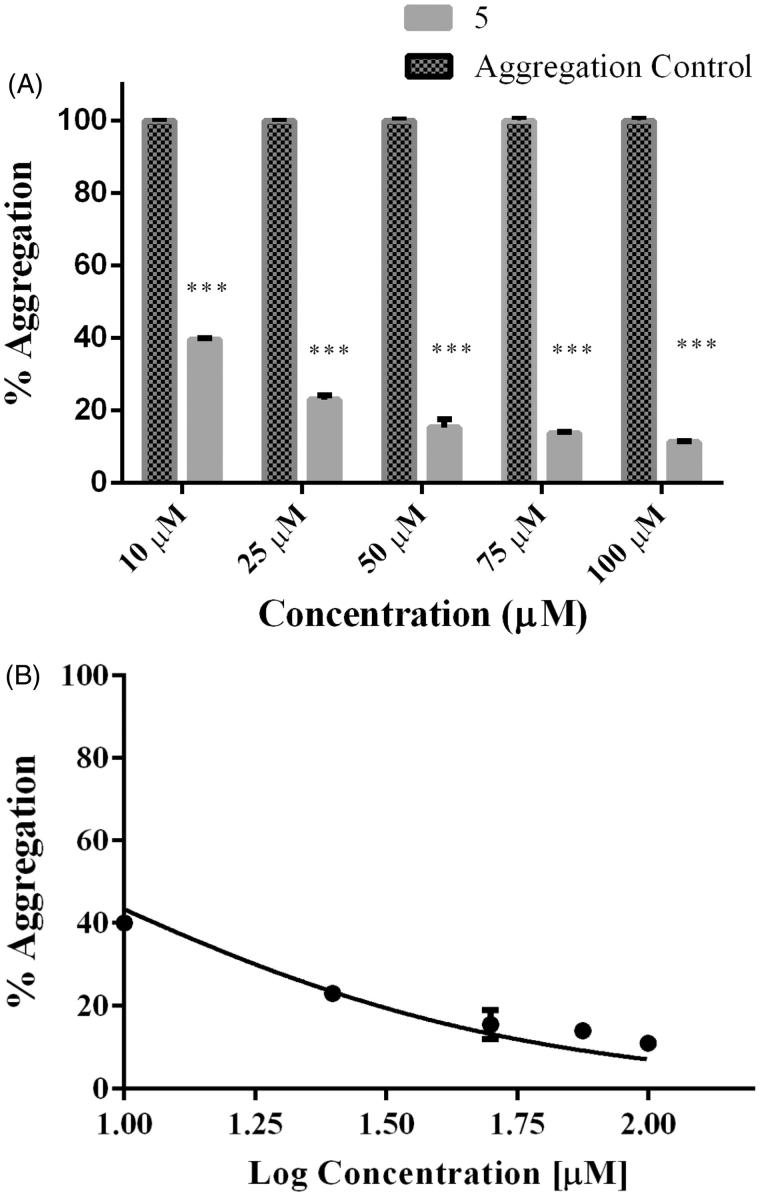
Figure 3.
Dose–response effect of 5 over tau 4R aggregation process monitored by ThT. Serial concentration of 5 between 10 μM and 100 μM. B) To obtain IC50 the curve fit method was set as non-linear regression. IC50 calculated correspond to 7.7 μM. Data were presented as mean ± SEM and analyzed using paired t-test showed there was a significant differences between control and treatment conditions t (8) = 15,406, p < 0.05.

