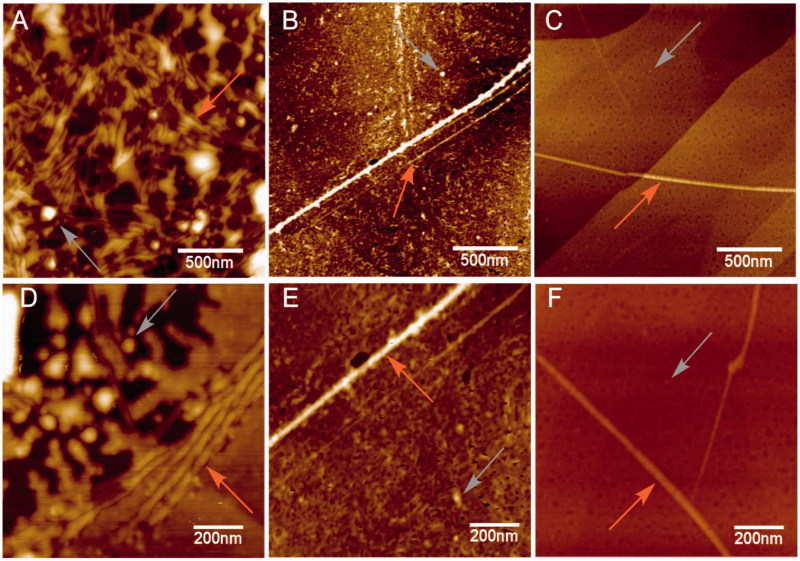
Figure 4.
Atomic force microscopy. Height images of 4R aggregation process in absence (positive control) and presence of 5, at two distinct magnifications. (A) and (D) Positive control (4R aggregation). (B) and (E) 4R aggregation in presence of 5 at 1 μM. (C) and (F) 4R aggregation in presence of 5 at 10 μM. Both gray and orange arrows represent oligomers and fibrils respectively.

