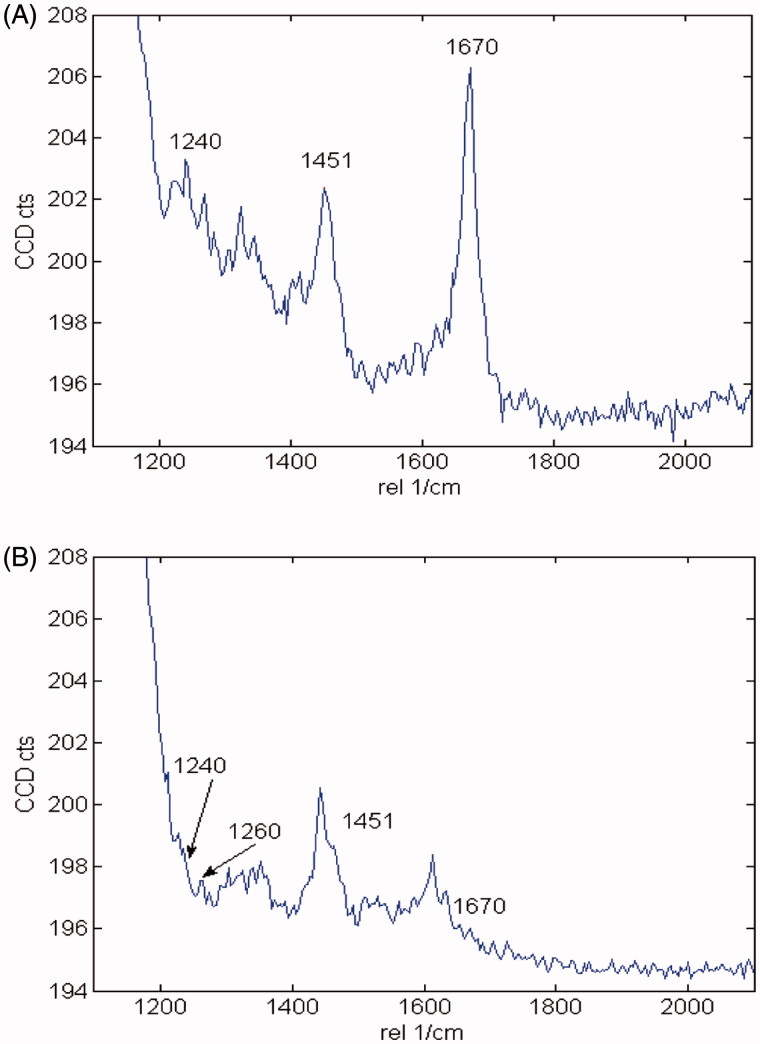
Figure 5.
Raman spectra of 4R after aggregation induction in both the absence and presence of 5. (A) Raman spectra of tau aggregation at 532 nm absence of 5. Band assignments correspond to Amide I (1670 cm−1), Amide III (1240 cm−1) and C–H deformation (1451 cm−1). (B) Raman spectra of tau aggregation at 532 nm in presence of 5. Band assignments correspond to Amide I (1670 cm−1), Amide III (1240 cm−1) and C–H deformation (1451 cm−1), Amide III (1260 random coil).

