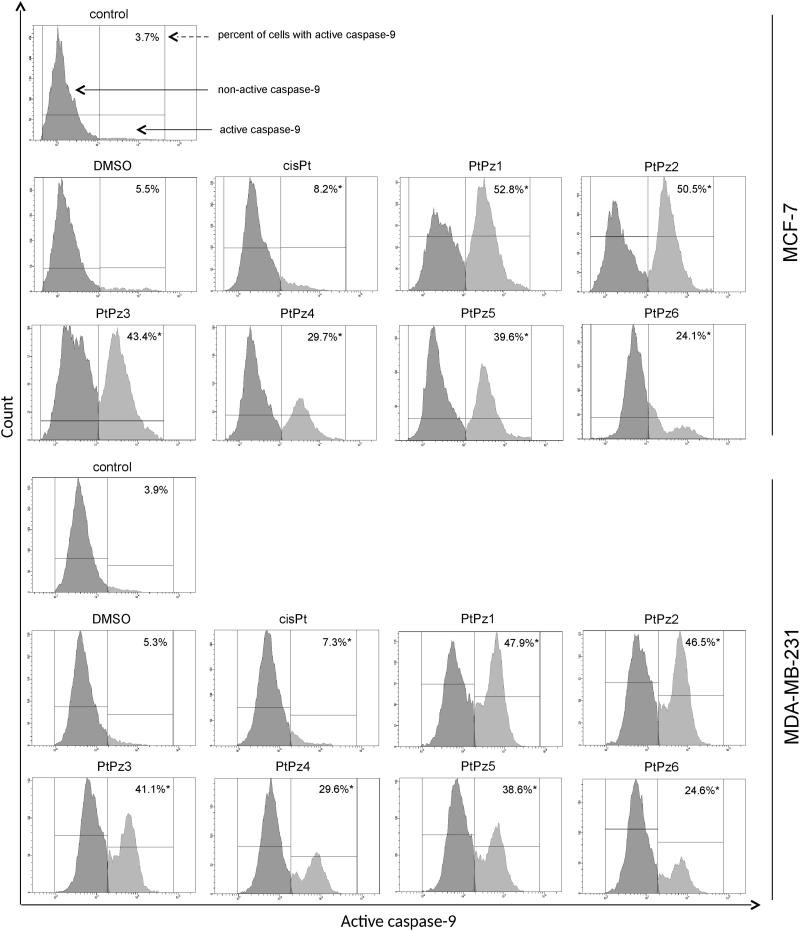
Figure 13.
Flow cytometric analysis of populations MCF-7 and MDA-MB-231 breast cancer cells treated for 24 h with PtPz1–PtPz6 (20 µM) and cisplatin (20 µM) for active caspase-9. Mean percentage values from three independent experiments (n = 3) done in duplicate are presented. *p < .05 versus control group.

