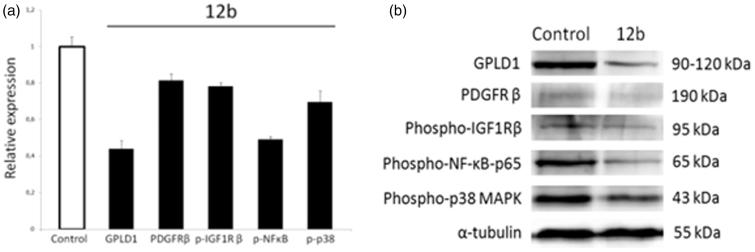
Figure 3.
Western blot analysis of predicted protein targets of compound 12b. Representative Western blots are shown detecting the cellular levels of selected proteins before and after treatment of A549 cells with indicated compound at 2 × IC50 value for 48 h. Approximate molecular weights (kDa) are indicated. Relative protein expressions, as determined by densitometric analysis of protein bands and normalised to the alpha-tubulin loading control. Two independent experiments were performed with similar results. Data are presented as mean values ± SD. Statistically significant (p < .05) differences in the expression levels were marked by an asterisk.

