Table 1.
The growth-inhibition effects in vitro of synthesised compounds on selected tumour and normal cell lines.
 | ||||||||
|---|---|---|---|---|---|---|---|---|
| IC50
a
(µM) |
||||||||
| Compounds | Purine or pseudopurine | R | A549 | CFPAC-1 | HeLa | SW620 | WI38/HFF-1 b | ClogP c |
| 4a | 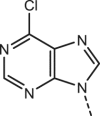 |
 |
53.22 | 33.39 | 34.21 | 38.94 | 5.21 | 2.68 |
| 4c |  |
15.91 | 7.90 | 12.30 | 14.69 | 0.75 | 3.44 | |
| 4d | 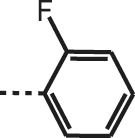 |
54.65 | 31.10 | 33.21 | 41.75 | 23.88 | 2.68 | |
| 4e |  |
88.95 | >100 | 57.96 | 92.50 | 6.58 | 1.68 | |
| 5c | 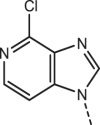 |
 |
9.43 | 7.39 | 22.52 | 11.77 | 5.21 | 3.29 |
| 5d | 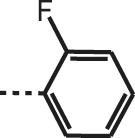 |
73.86 | >100 | >100 | 90.25 | 23.89 | 2.53 | |
| 5e |  |
>100 | >100 | >100 | >100 | 60.49 | 1.53 | |
| 6e |  |
 |
>100 | >100 | >100 | >100 | 73.63 | 2.14 |
| 7c |  |
 |
>100 | 89.24 | 36.80 | 68.95 | 19.43 | 3.29 |
| 7e |  |
>100 | >100 | 8.77 | >100 | 7.62 | 1.53 | |
| 8a | 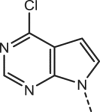 |
 |
85.36 | 48.37 | 39.41 | 8.50 | 32.18 | 3.44 |
| 8b |  |
64.52 | 47.69 | 65.46 | 44.64 | 21.02 | 3.84 | |
| 8c |  |
46.91 | 46.55 | 38.83 | 37.05 | 4.62 | 4.20 | |
| 8d | 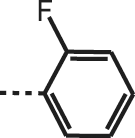 |
69.02 | 35.19 | 83.32 | 65.45 | 22.53 | 3.44 | |
| 8e |  |
69.19 | 36.27 | 33.59 | 73.48 | 39.93 | 2.44 | |
| 9c | 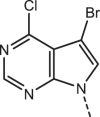 |
 |
66.36 | 62.77 | 32.89 | 55.74 | 57.54 | 5.03 |
| 9d | 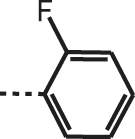 |
86.36 | 65.10 | 20.03 | 65.90 | 48.47 | 4.27 | |
| 9e |  |
45.45 | 47.30 | 24.50 | 45.09 | 10.78 | 3.27 | |
| 10a |  |
 |
>100 | >100 | >100 | >100 | >100 | 3.89 |
| 10b |  |
40.16 | >100 | 31.01 | 45.84 | 58.07 | 4.29 | |
| 10c |  |
71.57 | 64.71 | 53.01 | 54.25 | 24.03 | 4.65 | |
| 10d | 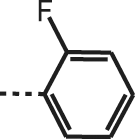 |
>100 | >100 | 82.92 | >100 | >100 | 3.89 | |
| 10e |  |
51.93 | 77.08 | 47.63 | 57.55 | 45.70 | 2.89 | |
| 11a |  |
 |
44.01 | >100 | >100 | 43.29 | >100 b | 3.95 |
| 11b |  |
>100 | >100 | >100 | >100 | >100 b | 4.41 | |
| 11c |  |
>100 | >100 | >100 | >100 | >100 b | 4.68 | |
| 11d | 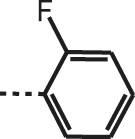 |
51.27 | 85.56 | 71.15 | 44.83 | 40.42 b | 3.95 | |
| 11e |  |
75.38 | >100 | 83.01 | 68.49 | 40.00 b | 3.17 | |
| 12a |  |
 |
76.26 | 86.52 | 71.70 | 99.92 | 91.91 | 3.14 |
| 12b |  |
0.79 | 52.55 | 42.17 | 91.23 | 38.10 | 3.60 | |
| 12c |  |
14.18 | 56.43 | 30.61 | >100 | >100 | 3.87 | |
| 12d | 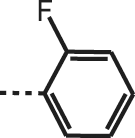 |
36.25 | 34.68 | 21.94 | >100 | 30.63 | 3.14 | |
| 12e |  |
>100 | >100 | >100 | >100 | >100 | 2.35 | |
50% inhibitory concentration or compound concentration required inhibiting tumour cell proliferation by 50%.
Compounds 11a–e were tested in HFF-1 cell line.
Values of n-octanol/water partition coefficients logP were calculated using ChemAxon algorithm (MarvinView Ver. 6.2.2.).
