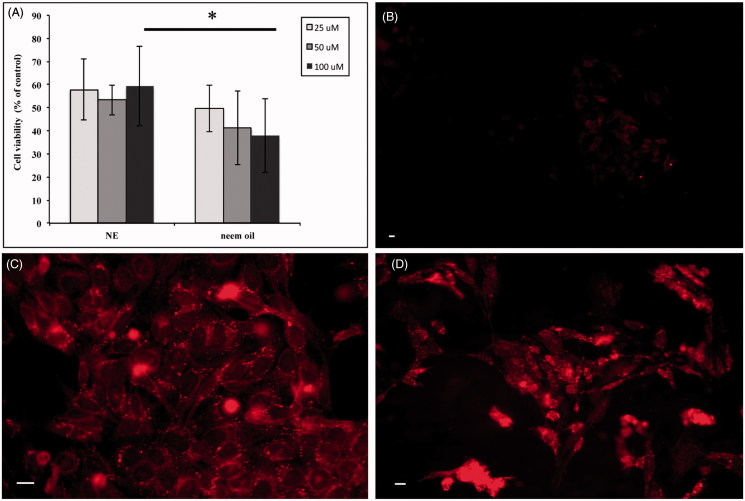
Figure 5.
Exposure of HEp-2 cells to Neem oil-based NEs. HEp-2 cells were treated with NEs or free Neem oil as described (see Methods). The OD values obtained by MTT assay for treated cells were converted into numbers of cells on a standard curve and expressed as percentages of untreated controls. Bars represent the mean of three independent experiments ± SD. *p < .05 (Panel A). Fluorescence microscopy images of HEp-2 control cells exposed to free Nile red (Panel B) and HEp-2 cells exposed to Nile red-loaded NEs for 7 (Panel C) and 24 h (Panel D) obtained by fluorescence microscopy as described (see Methods). Scale bar: 10 μm.

