Fig. 1.

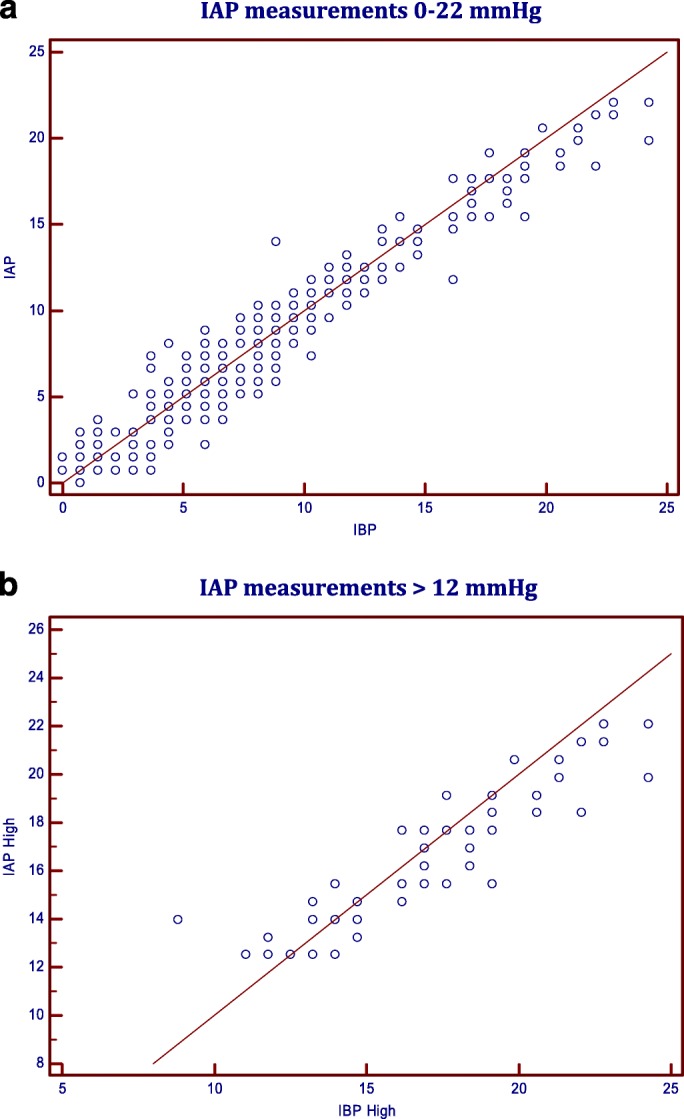
Scatter plot with line of identity for Lin’s Concordance Correlation between the two methods: a IAP measurements 0–22 mmHg; b IAP measurements > 12 mmHg

Scatter plot with line of identity for Lin’s Concordance Correlation between the two methods: a IAP measurements 0–22 mmHg; b IAP measurements > 12 mmHg