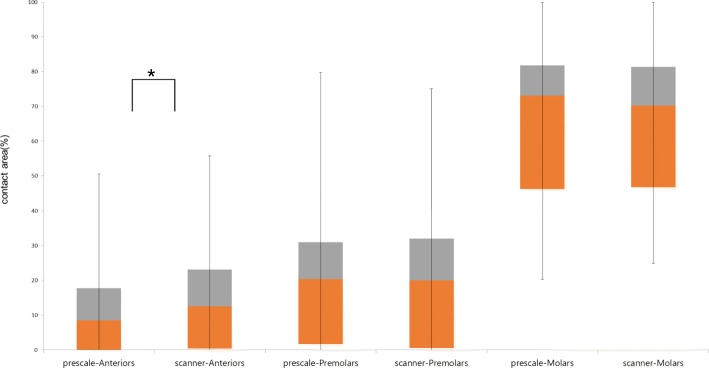
Fig. 5.
Comparison of box plots between occlusal contact area by intraoral scanner and prescale. Occlusal contact area (%) by intraoral scanner is similar in prescale for the group of Molars and Premolars. In Anteriors group, occlusal contact area by intraoral scanner is greater than prescale. The plots shows median, 25% quartile, 75% quartile and maximum-minimum range. Significance level: *; p < 0.05 by paired t-test

