
Figure 2.
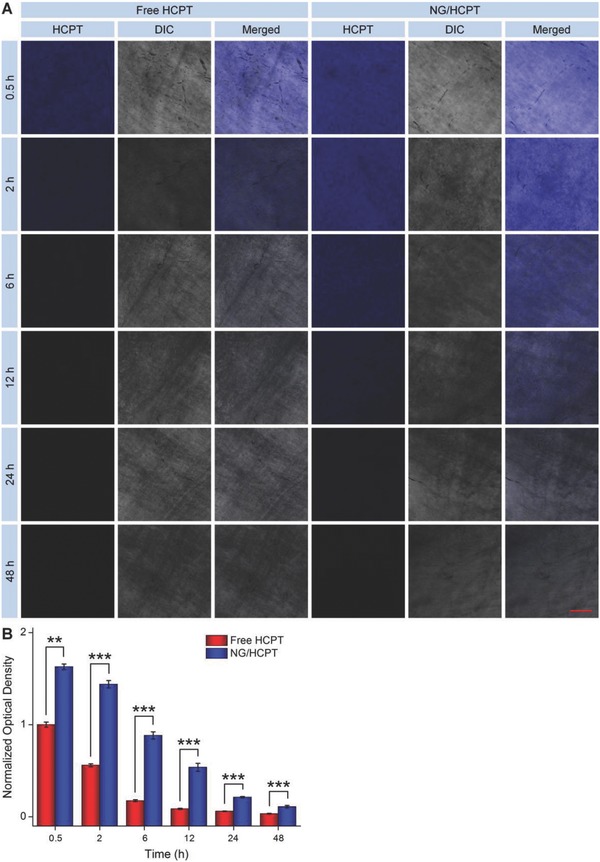
Mucoadhesiveness. A) Urothelial surface observed by CLSM to investigate the mucoadhesion of free HCPT and NG/HCPT. B) Statistical analysis of optical density of HCPT fluorescence intensity. The scale bar in (A) represents 100 µm. Data are presented as mean ± STD (n = 3; **P < 0.01, ***P < 0.001).