
Figure 3.
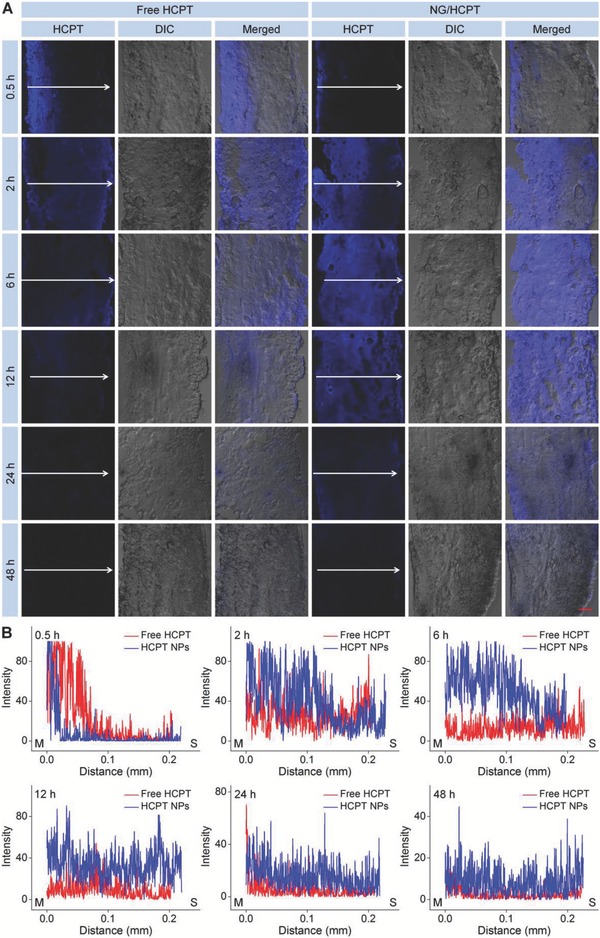
Penetrability. A) Penetrability of free HCPT and NG/HCPT investigated by CLSM. B) Statistical analysis of optical density of HCPT fluorescence intensity. The arrow represents the penetration direction of HCPT. The scale bar in (A) represents 100 µm. M, mucous membrane; S, serous membrane.