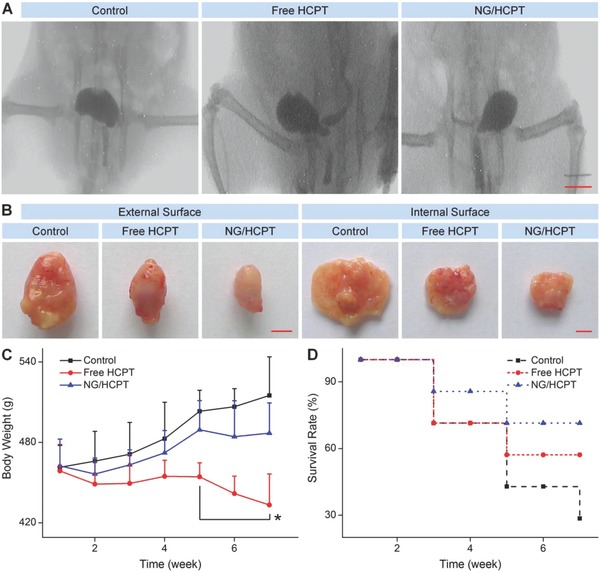
Figure 4.

In vivo tumor inhibition. A) Cystography. B) Intact and opened bladders after the end of treatment. C) Body weight and D) survival rate during treatment with PBS as a control, free HCPT, or NG/HCPT. The scale bars represent (A) 1.0 cm and (B) 0.5 cm, respectively. Data are presented as mean ± STD (n = 7; *P < 0.05 refers to the statistically significant difference between the groups of free HCPT and NG/HCPT at each time point).
