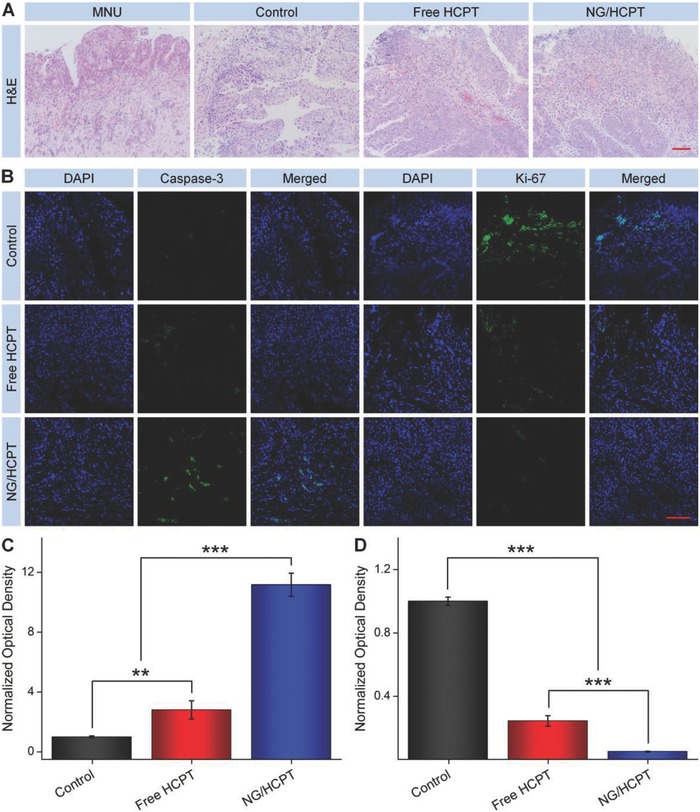
Figure 5.

Histopathology and immunohistochemistry. A) Histopathological (i.e., H&E) and B) immunohistochemical (i.e., Caspase‐3 and Ki‐67) analyses of tumor tissue sections after treatment with PBS as a control, free HCPT, or NG/HCPT. The scale bars in (A) and (B) represent 200 and 100 µm, respectively. Relative optical densities of tumor sections from C) caspase‐3 and D) Ki‐67 after treatment with PBS as a control, free HCPT, or NG/HCPT. Data are presented as mean ± STD (n = 3; **P < 0.01, ***P < 0.001).
