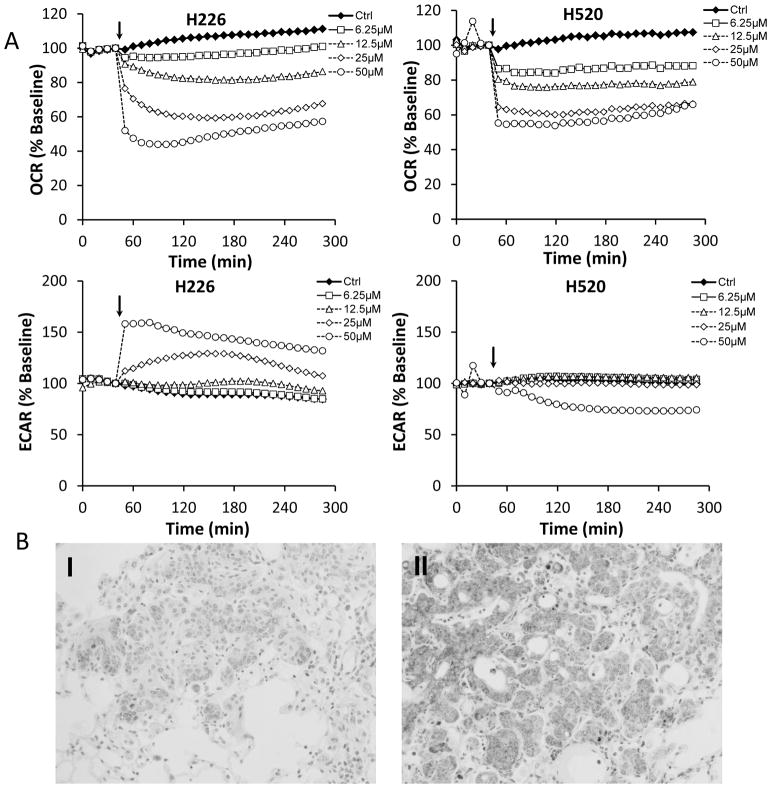
Figure 3. Honokiol suppresses mitochondria function both in vitro and in vivo.
A, Bioenergetic profile of H226 and H520 cells treated with honokiol. H226 and H520 cells were seeded at 30,000 cells per well in specialized V7 Seahorse tissue culture plates. Changes in OCR (upper panel) and ECAR (middle panel) were monitored at 37°C for 4 hours. The resulting effects on OCR and ECAR are shown as a percentage of the baseline measurement for each treatment. Data shown are the means ± SE (n = 5 per treatment group). B, Effect of honokiol on mitochondria in NTCU-induced lung scc model. Lungs FFPE tissue slides (n = 5 mice/group) were stained using specific antibody against cytochrome C. I, II: Representative picture from immunohistochemistry for cytochrome c release (I, control group; II, Honokiol group).

