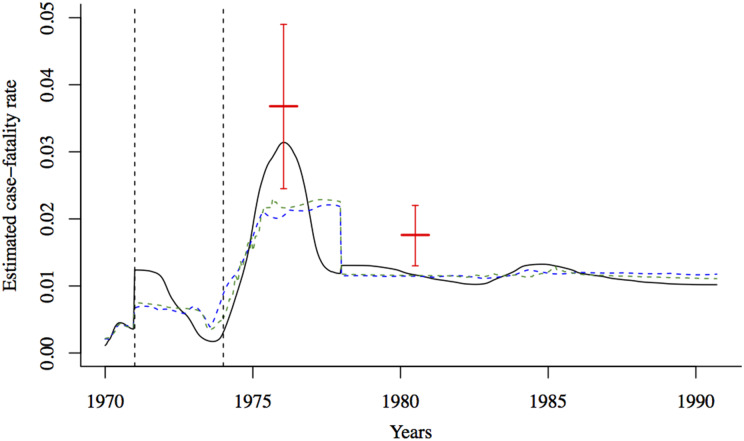
Fig. 2.
The estimated CFR from the regression of cumulative births against cumulative deaths using three estimation methods (black solid line: spline regression; blue dashed line: loess regression, green dashed line: lowess regression). The case-fatality rate for measles was estimated to be around 0·037 (95% binomial CI 0·025–0·049) in the Matlab area between August 1975 and July 1976 [5], and 0·018 (95% binomial CI 0·013–0·022) in 1980 [27] (indicated by solid red lines). The dashed vertical black lines indicate the onset of the war (1971) and the famine (1974).

