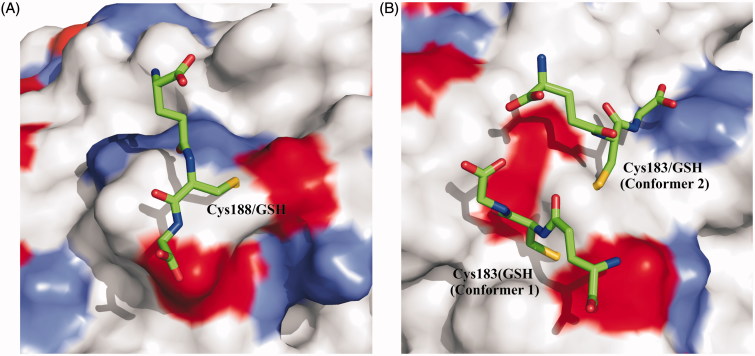
Figure 4.
Schematic representation of (A) Cys188-GSH adducts and (B) Cys183-GSH. The two Cys183 conformers are indicated as 1 and 2. Surface representation of CA III is also reported showing the positive charged residues (Lys and Arg) colored light gray, while negative ones (Asp and Glu) colored black.

