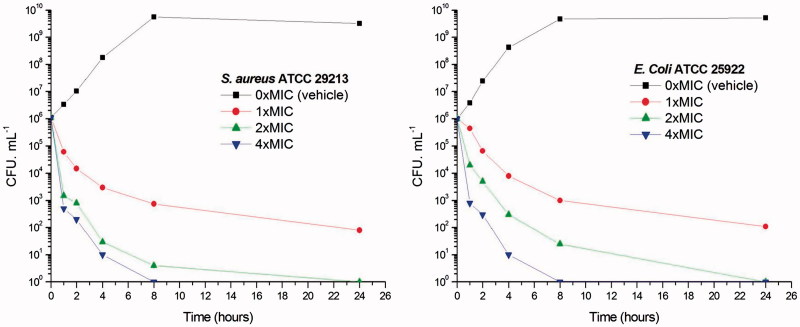
Figure 2.
Time-killing curve of A2. (A) At time zero, samples of a growing culture of S. aureus ATCC 29213 were incubated with concentrations of A2 equivalent to 1 × (red), 2 × (green), or 4 × (blue) the MIC. (B) Samples of a growing culture of E. coli ATCC 25922 were incubated with concentrations of A2 equivalent to 1 × (red), 2 × (green), or 4 × (blue) the MIC. Vehicle (1% DMSO; black) was included. Samples were removed at the time intervals indicated for the determination of viable cell counts.

